USDILS Double Bottom + RSI DivergenceLong Term Goal is 3.78566
Short term goal is 3.70643
ISRAEL DID 9/11
ILSUSD trade ideas


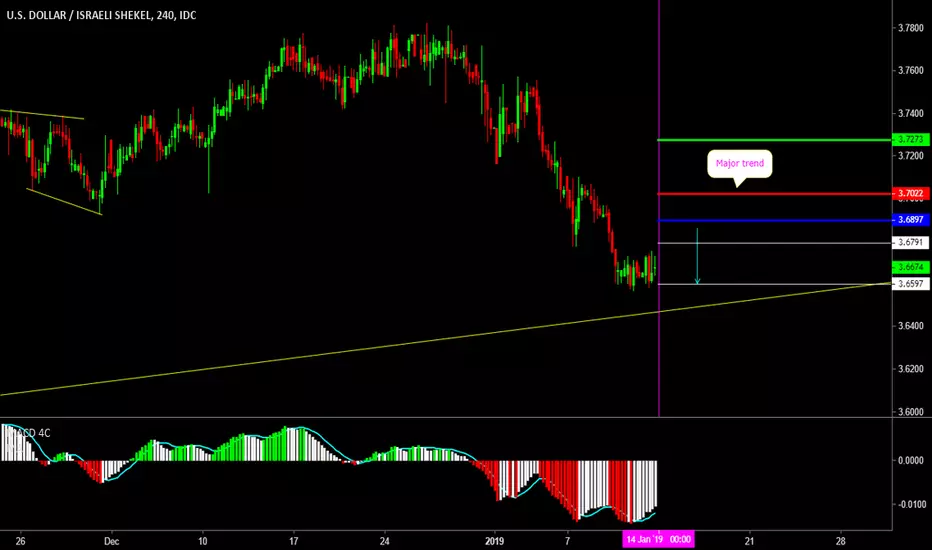
shortfrom 2018 Jan until now it did go in 4 waves, the fourth wave shows the short in the USD / ILS, the last wave will keep slowly going down and it should stop on 3.60 until the end of February 2019.

shortfrom 2018 Jan until now it did go in 4 waves, the fourth wave shows the short in the USD / ILS, the last wave will keep slowly going down and it should stop on 3.60 until the end of February 2019.

waves With the price remaining below the resistance, we are waiting for the trend to retrace near the 618 levels of the previous wave, and it is confirmed when breaking the ascending channel


USDILS: Rising Wedge within a Channel Up. Buy opportunity.The pair is trading on a Rising Wedge within a wider 1D Channel Up (RSI = 59.015, MACD = 0.014) and the neutral Highs/Lows (0.0000) indicate that it is close to pricing a Higher Low. The long's obvious TP is the Wedge's Resistance at 3.7900 but if it breaks we will extend the buying to 3.8200.
** If you like our free content follow our profile (www.tradingview.com) to get more daily ideas. **
Comments and likes are greatly appreciated.


Traditional technical analysisanalysisTechnical Analysis of the USD / ils on 04/12/2018. The basis of the analysis is based on the bullish channel formed on this pair with the general bullish trend according to Fibonacci levels and strong resistance points

Planning a short on the US Dollar vs Israeli ShekelI have been looking at this for a week or so and it is getting close to short area. You can see the trendline I have at the top there. Have an alert set on that, once it crosses that price it is in extended area, will look for it to turn there and pull back. Long term this will head to 4.
Can be played with BTC and massive margin @ bit.ly
........
........

bullish shark patterni think we are forming a bullish shark pattern so i think we wait the D point in one of this pricese 3.60 , 3.57 , 3.55 ,

Analysis of technical datato understand where we are . the down trendline make as a resistance but also whe can see inverted head and shoulder pattern , if the inverted head and shoulder pattern fail (as i expect) , that mean whe are in strong down trend , that mean we can depend on double top pattern and rising wedge pattern , but if it pass that mean we are in strong up trend , We will know that soon.


USDILS: SHORT .. Get readyRead the notes carefully before shorting.
If you want me to update this chart, please support it by your likes. You may pm me for any information.

Head and ShouldersWaiting for the price reversal of the current resistance ,,, I expect to take a head and shoulders model

USDILS: LONG with careStill there is a room for upside. Your eyes should be watching any higher high for shorting within a couple of days.

USD/ILS 1H Chart: Pair waits bullish confirmationUpside risks dominated the USD/ILS exchange rate after the pair reversed from the lower boundary of a long-term ascending channel located at 3.5758.
The rate is trading near the upper boundary of a short-term ascending channel. Given that the currency pair is supported by the 55-, 100– and 200-hour SMAs, it is likely that a breakout from the junior channel occurs during the following trading sessions. A potential upside target is the monthly R2 at 3.6912.
By the large, it is expected that the exchange rate continues its increase until the Fibonacci 0.00% at the 3.7177 mark.
