IMXUSDT trade ideas

IMXUSDT Steady Ascent in Ascending Channel 📈💎 Over the past 30 days, #IMXUSDT has maintained a consistent upward trajectory within the confines of an ascending channel. Throughout this period, the price has remained above a critical demand zone, situated near $0.6962, suggesting strong interest from buyers in this area.
💎 Recently, #IMX tested the support zone once again, effectively bouncing off the bottom of the ascending channel. This price action signals a continuation of the upward trend, with #IMX potentially aiming for the 161.8% Fibonacci resistance at $0.8360, which aligns with a previously established supply zone.
💎 However, it is essential to consider an alternative scenario where a downtrend takes shape. In this case, a break below $0.6710 would signal a shift from bullish to bearish dominance.

IMX liquidity grab done imx wicked above its strong rejection line and is now trading below it i think that all shorts stop loss are hunt and its now heading towards my target point always manage your risk before taking trades to stay in trading space good luck !

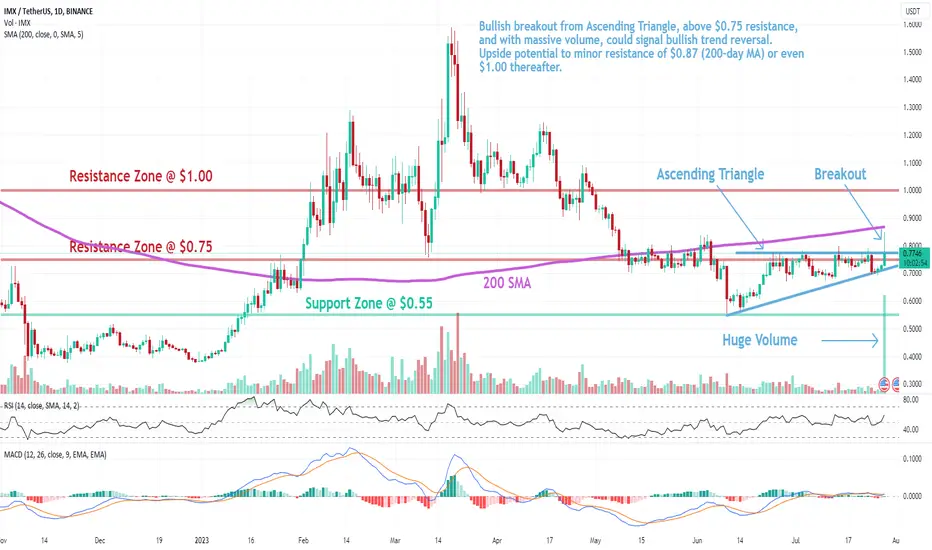
IMX: Ascending Triangle BreakoutTrade setup : Bullish breakout from Ascending Triangle, above $0.75 resistance, and with massive volume, could signal bullish trend reversal. Upside potential to minor resistance of $0.87 (200-day MA) or even $1.00 thereafter.
Pattern : Ascending Triangle which is a continuation pattern (it typically breaks out in the direction of existing trend). Most traders wait for a breakout but Swing traders could trade between the trendlines (Buy at Support, Sell at Resistance) as long as the trendlines are still relatively far apart.
Trend : Neutral on Medium-Term basis and Downtrend on Short- and Long-Term basis.
Momentum is Bullish (MACD Line is above MACD Signal Line and RSI is above 55).
Support and Resistance : Nearest Support Zone is $0.55. The nearest Resistance Zone is $0.75, which it broke, then $1.00, and $1.30.
IMX/USDT bullish setup …!!👀 🚀IMX Today Analysis💎 IMX is primed for a bullish move as it's currently trading within a falling wedge pattern while maintaining strong support. We're anticipating a breakout in the near future.
💎IMX is on the verge of crossing over the EMA 50. If it manages to sustain its position above this level, it could further bolster the bullish momentum.
💎The VRVP is currently showing substantial volume, which is another factor to consider. Moreover, trading in a high-demand area could be a strong signal for a bullish move.
💎If IMX manages to break the resistance area at .749, we could see a significant move towards the $1 mark
💎However, if the price re-enters the box area, it could trigger a significant downward move.
💎In the dynamic world of crypto, staying informed and adaptable is key. Stay tuned for more updates and enjoy your trading journey

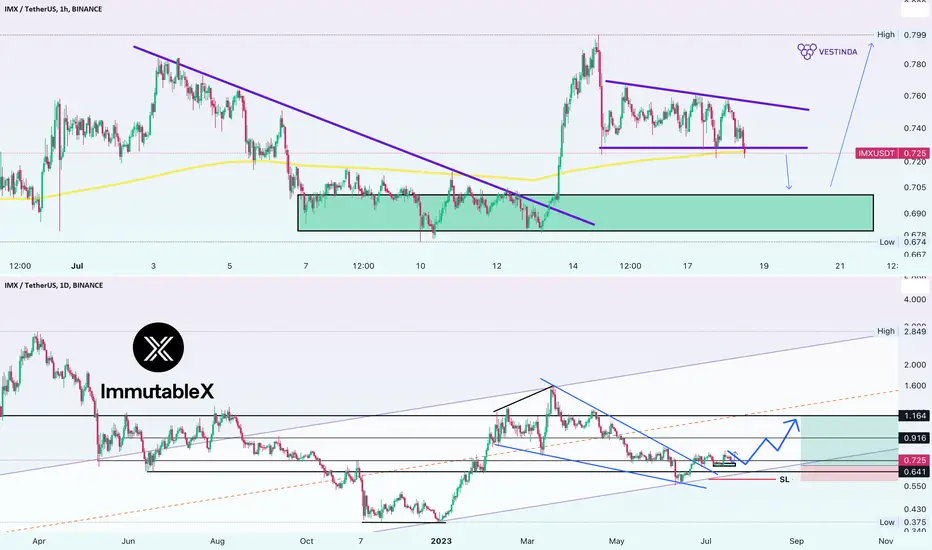
ImmutableX IMXUSDT Price Analysis (1h - 1d)📊✨ IMXUSDT on the 1h timeframe presents an interesting opportunity! Here's what we observed:
Support Zone: There is potential for a slight dip towards the $0.70 support zone, which could set the stage for a potential rebound.
Big Picture Analysis: Looking at the 1-day timeframe, we see a larger structure supporting an upward move.
RSI Divergence: IMXUSDT shows a strong correlation with RSI Divergence, making it a reliable indicator for predicting price movements.
Breakout from Resistance: The price has broken out from the red resistance line, signaling a potential rise and presenting a bullish opportunity.
Bullish Divergence: Prior to the breakout, a bullish divergence pattern was observed, further supporting the anticipated upward movement.
🎯 Price Targets: Our analysis identifies two significant targets at 0.916 and 1.164, representing strong historical resistance and support levels.
Considering the correlation, breakout, and bullish divergence, we anticipate a potential rise in IMXUSDT.

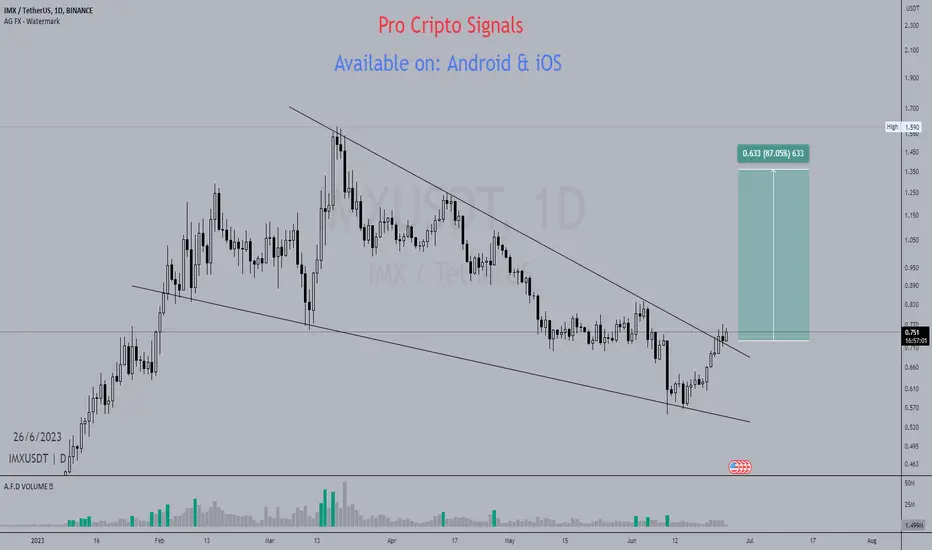
IMX good level for breakAfter a fairly long consolidation, a locally upward movement began.
We are seeing increasing volumes and a tightening of the resistance zone, which can tell us about the continuation of price growth.

45% chance of growth after a little patienceFor this currency, according to the corner pattern and the head and shoulder pattern, there is a break of an important resistance range that coincides with the neck line, so for now we have to wait for it to reach this range and a break with consolidation for this currency. If it happens, then according to technical analysis, we can have a safe entry for this currency with a risk to a good reward.
Analysis every day...


IMX USDT: Short term 2x potential!! We lose the range (danger zone) after spending a considerable amount of time trading within it. We will take part in this by making our trade on the new higher low, which I anticipate will be at the level of 0.6150 since the begin of the big impuls to the new high is a important price point.

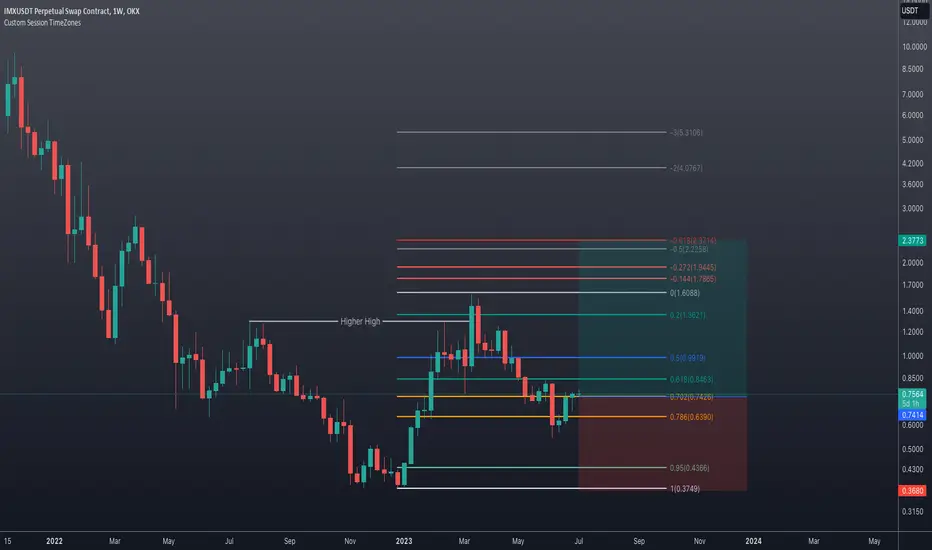
$IMX long tradeIMX is putting in some decent market structure where we could bet on a higher high. Current validation conditions are that the last swing high was a higher high on the weekly time frame.
And we are currently bouncing the the optimal trade entry zone for a fib movement.
Can wait for further confirmation with a higher high on the fractal move around current price ranges.
IMXDisclaimer
High Risk Investment
Trading cryptocurrencies and Forex carries a high level of risk, and may not be suitable for all investors. Before deciding to trade cryptocurrency you should carefully consider your investment objectives, level of experience, and risk appetite. The possibility exists that you could sustain a loss of some or all of your initial investment and therefore you should not invest money that you cannot afford to lose. You should be aware of all the risks associated with cryptocurrency and Forex trading, and seek advice from an independent financial advisor. Since Any opinions, news, research, analyses, prices, or other information contained on this website is provided as general market commentary, and does not constitute investment advice. The Bibres will not accept liability for any loss or damage, including without limitation to, any loss of profit, which may arise directly or indirectly from use of or reliance on such information. All opinions expressed are owned by the respective writer and should never be considered as advice in any form.
A qualified professional should be consulted before making any financial decisions.
-------------------------------------------------------------------------------------------------------------------

ImmutableX IMXUSDT Price Analysis (1d)Analyzing IMXUSDT on the 1-day time frame has revealed some interesting insights.
Here's an overview of our analysis:
RSI Divergence: Our analysis indicates that the price of IMXUSDT highly respects RSI Divergence, demonstrating a strong correlation between the two. This suggests that RSI Divergence can be a reliable indicator for predicting price movements.
Breakout from Resistance: Currently, we are witnessing a breakout of the price from the red resistance line. This breakout indicates a potential rise in price and presents a bullish signal for traders and investors.
Bullish Divergence: Prior to the breakout, we observed a bullish divergence pattern, further strengthening the indication of a potential upward movement. This pattern enhances our confidence in the anticipated rise in price.
Price Targets: Based on our analysis, we have identified two significant price targets. The first target is at 0.916, representing a strong resistance level in the past. The second target is at 1.164, which has served as a notable support level. These levels present attractive targets for potential price breakout
Taking into account the strong correlation between price and RSI Divergence, along with the breakout from resistance and the presence of bullish divergence, we have a compelling case for a potential rise in IMXUSDT. Our price targets of 0.916 and 1.164 provide clear levels to monitor for future price action..

$IMX Breaking out of Falling Wedge $IMX Breaking out of Falling Wedge on the Daily TF Chart..!! Looks Promising for 80-90% Bullish Rally..
IMX - ImmutableXI've made the decision to buy some IMX (SPOT) with a target of 0.95, 1.25, 2.1. I've split the order into three parts: the first at the 0.6, the second at 0.5 and third at 0.4.
The information provided here is for informational purposes only and should not be considered as financial or investment advice.

IMXUSDT heading towards daily support, long favorable from thereThe price seems to be heading towards the daily support DS1. This daily support zone is sitting around 0.601-0.609. A long will be favorable from that zone as the probability of the price to bounce from that support is high. The target of the long trade shall be first 0.623 and then 0.634 as marked on the chart.

There are signs of shortThe tool has fulfilled its purpose
1) Corrected dips to 0.618 level
The instrument shows signs of decline
1) Bear engulfing
2) Falling volumes
3) Three peaks
I'm not sure that we will update the bottom, but the fact that we will fall for sure!
We'll be watching, time will tell!
Don't mess around with derivatives!
Regards,
Eugene


IMX/USDT scalp LongUsualy I wanna see the blue inside of a green on my Indicator, but lets wait and see, how this one will play out, but that divergence on MacD can not be ignored.

IMXUSD ❕ trading in the liquidity zoneIMX is moving near the liquidity zone.
Price and RSI chart have formed a bullish divergence (1H TF)
The asset has broken up 50EMA on the 1H Timeframe.
I believe price could continue to rise if it fixes in the liquidity zone.

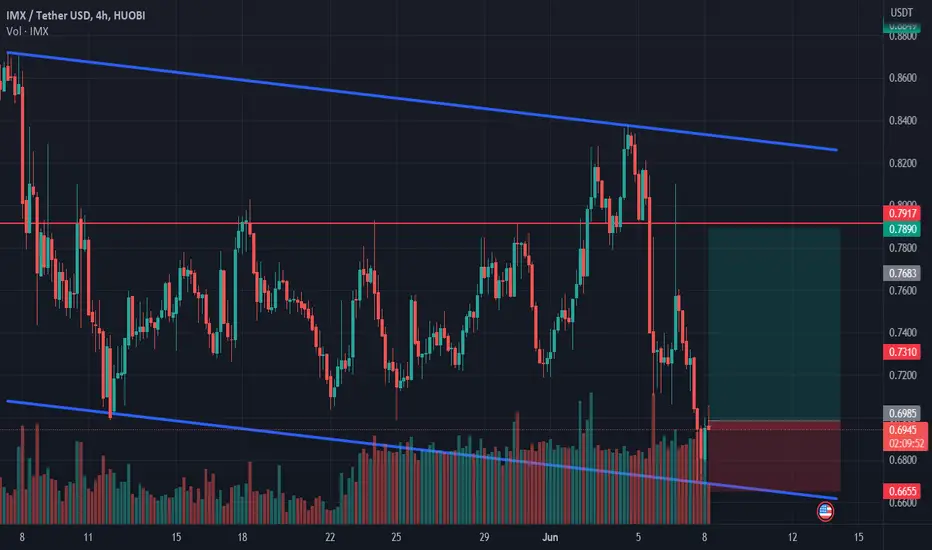
IMX longIMX bounced off the lower boundary of descending channel. Bullish movement to resistance level at 0.789 is possible.
IMXUSDTIMXUSDT has given the breakout of long term consolidation , and currently retesting the breakout. If the retest hold perfectly, then the estimated targets are 0.84 to 0.90.
