000001 trade ideas

SSE Double bottom / Bull div playSSE seems to be forming a double bottom at the 2470 support level; this in combination with the RSI and Momentum bull divergences and previous candle being a hammer candle makes me think we might be getting a relief rally to 0.786 fib level that corresponds to previous support.
More conservative trade would be waiting for a break of the green dotted line that would confirm the double bottom and break the downtrend with a stop loss below the line.


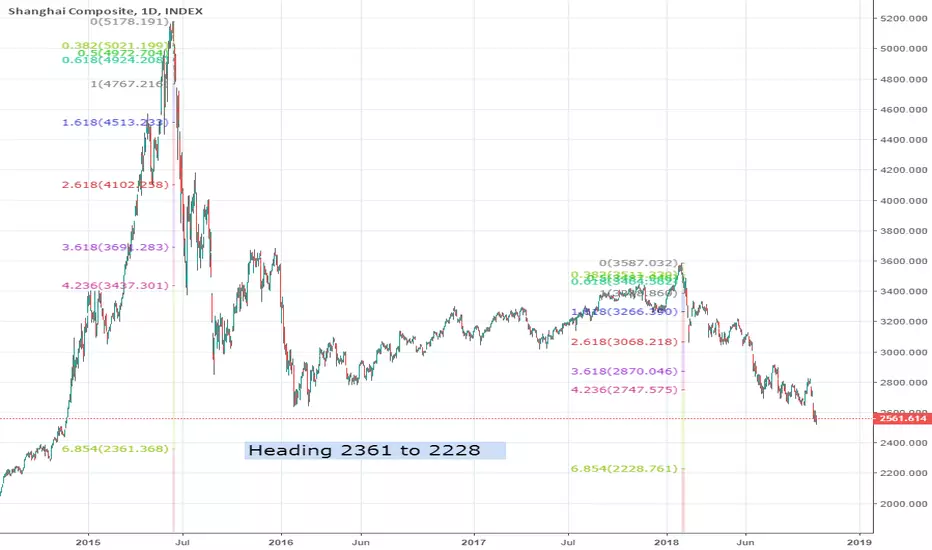
Shanghai Index - Another 10% to goThe under-performed market seems like another 10% to go. Based on fibonacci spirals projection, the 2015 projection suggesting price to reach 2361. And current projection from 2018 high at 2228.
China Bull? Just a bit of fun but they sure have a few similarities comparing the Shanghai composite to the Nasdaq composite. The blue overlay is the Nasdaq composite index from 1990 to the present day. Could history repeat? No idea. But if it does, I won't miss the train.....

70 pips more to drop or 2.5% more on the downsideChina SH composite is approaching 2016 low at 2638.
Adding the background the BOC raised the forward reserve requirement for foreign exchange and RMB surged.
If look at the down side, 70 pips to drop/-2.5%, will possibly see a resistance showed at the 2016 retracement low @ 2638.
Personally also considered it as the psychological support of investors.
Hope the index can stop there and enter into a new rebound. goldtrader666

Short SH Composite E=3309, Target T=3233 (-2.24%)SH composite Daily trend is down, should drop to wkly dz=3233.
