Keeping an eye on #INJ/USDT $22 level in 4-Hour TF!Keeping an eye on #INJ/USDT $22 level in 4-Hour TF!
There is a 4-Hour FVG gap, and the SSL liquidations hunt is already done. CRYPTOCAP:INJ will pumped from there. Placing limit order there.
INJUSDT trade ideas
INJ - strong looking coinINJ looks strong as hell but I am going to take 25% out here as we still can't flip this 24 Q1VAH level on BTC and there is nothing wrong with taking profits 😉
If BTC flips this level we should pump hard but as far as as we didn't there is a chance for a sell off.

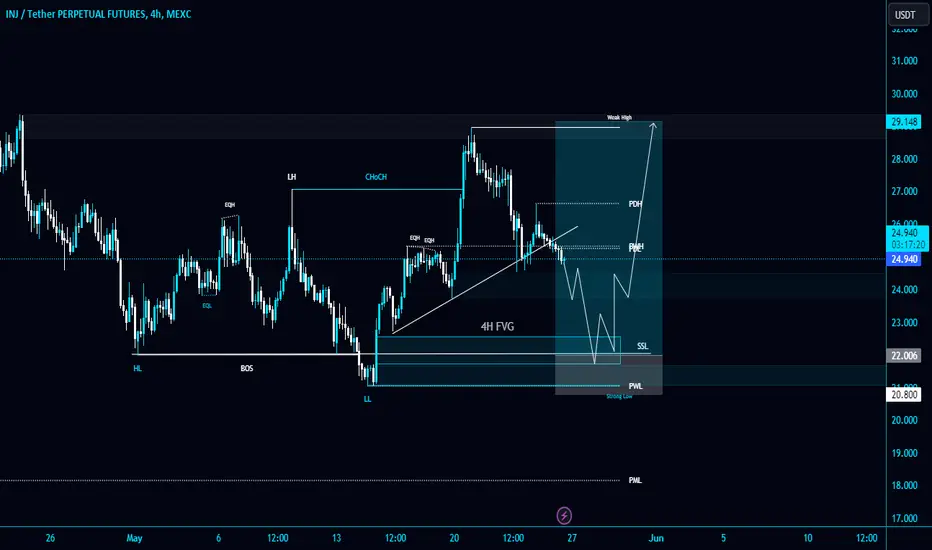
#INJUSDT | 4 HOUR TIMEFRAME UPDATE#INJUSDT | 4 HOUR TIMEFRAME UPDATE
We can look for confirmation to open a LONG position in the range of $22.853 - $21.800✔️
The objective for this UPWARD movement is to achieve $24.130 - $24.928 - $26.030 - $27.150 - $29.700 🔼
Invalidation below $20.970 ❌

#INJ/USDT#INJ
The price is moving in a bearish channel pattern on a 24-hour frame, and it adheres to it well and is expected to break it upward
The price rebounded well from the lower border of the channel at the green support level of 22.00
We have a tendency to stabilize above the Moving Average 100
We have oversold resistance on the RSI indicator to support the rise, with a downtrend about to break higher
Entry price is 23.70
The first target is 25.80
The second goal is 27.00
Third goal 29.30

$INJUSDT UPDATE$Dear Respected Traders, we hope this communication finds you well.
we are convening a discussion focused on #INJUSDT
THE Decending Triangle Pattern Breakout Has Already Done With a Solid Candle✅
So,I Expect a Bullish Move of 50% In Coming Days 🚀
#Bitcoin #Crypto #Ethereum #Cryptocurrency #CryptoTrading #BTCUSDT #ETHUSDT #ALTCONS #USDT CRYPTOCAP:BTC CRYPTOCAP:ETH CRYPTOCAP:USDT

INJ Trade Analysis: Bullish Outlook 📈Current Market Context:
INJ is breaking out of a downtrend and demonstrating bullish momentum. The recent transition to a deflationary model adds a strong fundamental case for long-term holding.
Trade Strategy:
Entry: Initiate a trade at the current market range of $25 - $26. This entry point leverages the ongoing bullish breakout.
Take Profit: Set multiple take profit targets to lock in gains at different stages:
First Target: $29
Second Target: $35
Third Target: $45
Stop Loss: Place the stop loss at $23.17 to manage risk and protect against potential downturns.
Rationale:
Fundamentals: The deflationary model and strong metrics support a positive long-term outlook.
Technical Analysis: The break of the downtrend indicates a potential shift to a bullish phase, supported by lower time frame (LTF) analysis.

INJusdt trading opportunityINJUSDT has recently made a significant move by breaking above its previous all-time high (ATH) and is currently maintaining its trajectory within an ascending channel, with the price targeting the channel's upper trendline.
A potential pullback towards the previous ATH could be anticipated as a re-test before a further rally ensues. Our analysis has identified crucial demand areas on the chart that represent potential buyback zones should the price retrace to these levels as expected.
Additionally, we have outlined both potential and immediate targets for this setup. Updates on this post will be provided as the price action unfolds.
We encourage you to share your perspectives on this analysis and to show your support by liking the post.
Thank you.


$INJ Long term tradeMy next trade idea for $INJ. Bounce at the 200MA (demand zone), strong community, still currently in accumulation. If lower low made, idea is invalid.
Clearly descending wedge seen on the daily chart, this is typically a predictable structure that will play out to the upside.
Given the fact bitcoin has left its slump, I have conviction this will play out successfully.

INJ +100% in spot.So, #INJ has dropped by more than 50% from its recent local high of around $53. On the chart, there is a clear trend line that the price is responding well to. Additionally, we have Fibonacci support at the 0.236 level.
I am considering entering a position from the current values both in spot and futures. For myself, I have chosen to use credit leverage with a multiplier of x2, as in previous ideas.
Target - $50
Stop Loss - $17.5
This is not financial advice; everything you do, you do at your own risk!

INJ Injective takes a breather?
It has run nicely since the lows with incredible strength. But surely a correction will be necessary at some point.
Here we have some fib confluences in the area as well as bearish divergences. Similarity to the previous occurance might lead to 40-50% correction before resuming uptrend.
Surely not adivice to short here. Rather buy if hits zone in given time period
---
If you like my content, if it helps you gain profit, give it a like!
Thanks!
---
Hold my beer pls
----
No financial advice, do your own research, don't be stupid

InjectiveExponential charts can be a bit hard to trade
80% to the local highs here, you'd have to understand the pivot from dexperp to l1 here to understand why its marked up so heavily... id say were into aths by the end of the year though... 80$ target from the local highs so 4xish if we get the predicted post halving bullwave

INJUSDTA falling wedge is a technical chart pattern formed by drawing two converging trendlines that slope downward. It is characterized by decreasing price highs and decreasing price lows, with the upper trendline having a steeper slope than the lower trendline. This pattern typically signals a bullish reversal after a downtrend, as it suggests that selling pressure is weakening and the market may be preparing for an upward move. Traders often look for a breakout above the upper trendline as a signal to enter long positions, with stop-loss orders placed below the lower trendline. As with any technical pattern, it's important to consider other indicators and factors before making trading decisions.

INJ UPDATEFirst of all, You can see our previous analysis of inj in the "Related Ideas" section
A good demand area is now ahead of the price. We are looking for buy/long positions in this area.
We have marked this area with green color.
The targets are clear on the chart.
Closing a daily candle below the invalidation level will violate the analysis.
For risk management, please don't forget stop loss and capital management
When we reach the first target, save some profit and then change the stop to entry
Comment if you have any questions
Thank You

[INJUSDT] - this is why must get bullish!in 3D chart INJ still comsolidate a a massive ascending channel
price now retesting the lower side of the pattern which gathering with a 0.618 fib level which making it the most important support! ... that making price must rebounding from here!
- u can see the H&S pattern and clearly u can see that the pattern completed and declined to reach exact it's target
most time when pattern completed and reach it's target it reverse it's direction
so we expect volatility between 0.618 and 0.786 fib level in next days then get bullish.
appreciating for supporting us with ur "like " and follow for more ideas, updates🎯

📊INJUSDT currently consolidating between $29.57 resistance and 🔄 INJUSDT currently consolidating between $29.57 resistance and $22.77 support. 📈 Keep an eye out for potential breakout, aiming for $36.46 resistance, or breakdown towards $17.99 support. Stay alert! #CryptoAnalysis 📊

INJUSDT, breaks the descending channelHello, trader. Welcome to our cryptocurrency community! 🚀We're thrilled to have you here, whether you're a seasoned trader or new to the world of cryptocurrency.
We are willing to discuss #INJ.
#INJ USDT 🔥🚀.
Update: 💹.
#INJUSDT formed the descending channel over a 12-hour period.
Breakout confirmation is already completed ✅.
Breaking the strong resistance will result in a price target of around $40. 💹🚀.
We anticipate a nearly 47% increase in the near future (👉✅).

INJUSDT IDEAHello Traders Hope You Are Enjoying Our Analysis. Today We Will Discuss About INJ
(Update)
The Falling Wedge Breakout Confirmed On 12H Timeframe☑️
Expecting Massive Bullish Wave After Some Weeks⚡️

===== INJUSDT UPDATE. >>>>>>#INJUSDT
UPDATE
Hey dear members hope you all are enjoying our ideas and analysis. Now we are here to discuss about INJ
INJ is breaking the main Falling Wedge in Daily time frame ⏰
That indicates here we can see a good bullish wave. We can see gain gain here upto 50%+ soon✍

INJUSDT UPDATE #INJUSDT
UPDATE
Hey all friends and traders. Hope you are enjoying our analysis. we are here to analyze INJUSDT today.
ING is getting good volume & Successfull breakout done in 12H time frame .
We can see gain here up to 50%+ profit so far🚀

INJUSDT IDEAHello Trading view Family / Fellow Traders.
I hope you have used and benifited from the previous analysis .
In today trading session we are monitoring INJUSDT for a buying opportunity,
INJUSDT UPDATE
Descending triangle Breakout has Already Done ,with a very solid candle in 6H time frame💥
Now,Ready for good bullish wave 🚀 🚀 maximum chance to gain +40 profit💸 in coming days 💯✅

INJUSDT IDEAHey traders hope you are enjoying our analysis. Now we are here again with a new trading opportunity. We will discuss today about INJ
ON The 6H Time Frame ✍️
THE Falling wedge Breakout Has Already Done ✅
Expecting 40% Bullish wave in Coming day's 🚀📈

INJUSDT 12H#INJ has broken the falling wedge pattern on the 12H timeframe. Now it is facing with MA50. In case of a successful breakout, the targets are:
$31.44
$35.56
$39.68
$45.54
$53.00
