INJUSDT trade ideas

INJECTIVE PROTOCOL $INJ; Distributution is about to complete.INJECTIVE PROTOCOL (INJ) had a immense impulse out of the accumulation range. Now there are clear visible signs of weakness and rejection from weekly HTF resistance. At this confluence, moonboys are calling for three digits $INJ whereas I am conservatively looking for yearly open. The chart shows perfect example of a classic textbook wyckoff distribution schematic so I will follow it. THE BIG SHORT!

INJ CAN MAKE A CORRECTIONHi, dear traders. how are you ? Today we have a viewpoint to SELL/SHORT the INJ symbol.
For risk management, please don't forget stop loss and capital management
When we reach the first target, save some profit and then change the stop to entry
Comment if you have any questions
Thank You

INJ is at interesting buy level
INJ has been forming a kind of Wyckoff (re)accumualation.
Price action is at the end of Phase D, at SOS (sign of strength) step, more precisely.
As a result, a proposed setup is in chart.

Bitcoin is moving in parabolic and the INJ trade set up.In this video, I do analysis about BTC on current structure which is trying to smash the interim swing high resistance which consist of 2 alignment factors. How will it plays out? Enjoy the video guys! And also INJ trade set up for day trading.

INJSDT: Facing Resistance, Overbought, Retracement PotentialInjective Protocol (INJSDT) has recently experienced an impressive rally that saw the price surge from a significant support level around $2.50 to a crucial resistance level at $4.65. As the market now seems to be in a range, various indicators are signaling overbought conditions, raising questions about the next possible move for INJSDT.
Current Market Situation
At the time of writing, INJSDT's price has stalled around the $4.65 resistance level. This level has proven to be a barrier for the asset in previous instances, making it an essential price point to watch. The support level at $2.50 played a significant role in the recent bounce, and this level is worth noting as a potential target in case of a retracement.
Overbought Indicators
One of the critical factors in the current market situation is the overbought condition of various technical indicators. These overbought indicators suggest that the market might be due for a correction in the short term. In such a scenario, the price may either consolidate at the current level, allowing indicators to reset, or it could undergo a retracement to lower support levels.
Wave Master Indicator on the 4h Timeframe
The Wave Master Indicator on the 4-hour timeframe has been a reliable tool for gauging price trends and identifying potential market reversals. As of now, the indicator is beginning to curl down after the recent thrust upwards, indicating that the bullish momentum may be losing steam.
Potential Scenarios
Consolidation: If INJSDT's price consolidates around the current level for a few days, it could allow the overbought indicators to reset, paving the way for a renewed push towards higher resistance levels. In this scenario, the price could potentially reach the $5.35 to $7.50 range.
Retracement: Should the market fail to consolidate and the overbought conditions persist, INJSDT might experience a retracement back to lower support levels. The price could drop to around $3.00 before resuming its upward trajectory. This would still set the stage for a possible move to the higher resistance levels between $5.35 and $7.50.
The consolidation or retracement scenarios will depend on whether the market can stabilize and reset the overbought conditions or whether a deeper correction is necessary. As always, exercise caution and utilize proper risk management techniques in your decision-making process.

INJ/USDTINJ one of the stronger alts today but still think it's going much lower.
I can see a Double Top forming on HTF just needs a confirmation below $3.
In this LTF trade I'm waiting for price to go under $3.61 again, that would be a deviation of the LTF Mid Range and my trigger to short it.
First target is Range Low at $3. That is a big level for INJ. After that Goblin town.
Follow, like the idea and feel free to leave a comment.
Check out other ideas if you like this one.

#INJ, massive bounce over the last 48h#INJ
massive bounce over the last 48hs against everything else on the market
betting that this is a divergence and will catch up soon with the rest
UCTS signalling a 2D UCTS sell signal as trigger of the trade

INJ CAN DROP AGAINHi, dear traders. how are you ? Today we have a viewpoint to SELL/SHORT the INJ symbol.
For risk management, please don't forget stop loss and capital management
When we reach the first target, save some profit and then change the stop to entry
Comment if you have any questions
Thank You


Injective Protocol Analysis [November 7, 2021]The picture explains it all.
AB = CD pattern is telling take profit around $20 zone.
FIB is telling take profit around $22 zone.
Feel free to comment.
Kindly note this is not a financial advice. As we know, the cryptoverse is a highly volatile world. Do your due diligence.

INJ is an altcoin and you know what that meansThe numbers rise and fall like waves,
A game where no one saves,
For fortunes are made and lost,
In the blink of an eye, at great cost.
When investing in a volatile asset, it's important to not let greed cloud your judgement and instead focus on seeing the big picture. While it may be tempting to chase quick gains and try to time the market, this can lead to risky and irrational decisions that ultimately hurt your portfolio. Instead, it's important to take a long-term perspective and assess the fundamentals of the asset, such as its underlying value and potential for growth. By keeping a level head and making informed decisions based on the big picture, investors can navigate the ups and downs of a volatile asset with greater confidence and potentially reap greater rewards over time.
I'm going to be focusing on the range we are currently in. This is a range clearly defined by support and resistance levels identified early on. Late 2020. It was solidified in early and mid 2022 as we went back through this range.
Now we're right in the middle of it creating some price acceptance. But what comes next is what matters. Support and resistance trading is a popular strategy used by traders to identify key levels within a specified trading range where the price is likely to encounter buying or selling pressure. Support refers to a level where the price has historically found buying interest and is expected to hold up, while resistance refers to a level where the price has struggled to break through and is expected to face selling pressure. By identifying these levels, you can enter long or short positions accordingly, with a view to profiting from price movements within the trading range. However, it's important to note that support and resistance levels are not always precise, and the price may break through them or bounce off them with varying degrees of strength. As such, youshould use other indicators and risk management strategies in conjunction with support and resistance trading to improve your chance of success.
With these other indicators, I would like to focus your eye on the wave master indicator at the bottom of the chart. Notice it's very undecided right now. A great buy was alerted in December 2022 and as of right now, the daily green wave is resetting but the yellow/red waves are overbought. I would expect a bounce to come, but if we break the lower bound of this range that I've defined, I'd be very careful. Also notice the momentum indicator was flashing red in mid February but has gone away as we are resetting the daily green wave on the wave master.
I'd be bullish right now. Cautiously bullish. There's important levels below to watch out for but ultimately a bullish pivot at my white level would be important to hold over a couple days. Bullish targets would be around 7.75 and then around 13.00

INJ/USDT Price Prediction Chart AnalysisHello,
#INJ/USDT Technical Analysis Update:-
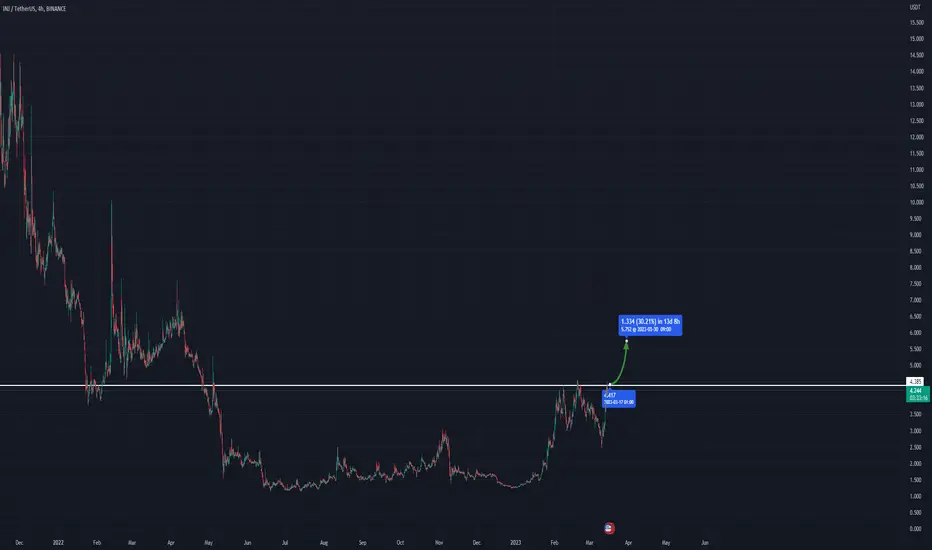
I have conducted a technical analysis on the INJ/USDT pair, which is currently trading at $3.416. According to my analysis, the projected growth for INJ in 2023 is 270%. However, the price is currently 25% lower than its recent high of $4.582.
Based on the chart, the price has broken down the neck line support and has converted to a bearish zone. Therefore, I am expecting a minimum 30% downward movement from the current price level, with a maximum of 44% to 50% also possible.
It is possible to anticipate another leg down from the $3.65 resistance/retest level. However, if the price goes above $3.80, it would invalidate the bearish chart.
Please take note of the following levels:
Support: $2.48/$2.00
Resistance: $3.80
If you found my analysis and content useful, kindly like and share it. Don't forget to follow me for the latest crypto live updates.
Thank you.

INJ/USDTINJUSDT is in a bearish
trend and a red candle
closed in a lower high
which indicates the
price can further down.

Short INJ vs USDTINJ is looking like it's forming a Double top pattern here on a Higher time frame chart.
The Double top will be confirmed if it turns $3 from support to resistance and that will be my 1st Target, 2nd Target Mid Range.
I'm not rulling out a one more push into the 4H block so I'm slowly scaling in, wrong if we see acceptence above $3.75.
As I said before, all bounces are for shorting until proven otheriwise.
Follow, like the idea and feel free to leave a comment if you like it.
Check out other ideas if you like this one.
