IOTXBTC trade ideas


33%+ Potential in short termit has a good news about its margin market, their CEO said smthng in his twitter acount about that.
good macd and bb

IoTeX (IOTX) Token| Another 1000% Bullish Wave On The WayHi friends hope you are well and welcome to the new update on my IOTEX token. The IOTX has surged more than 200% and in today's article we will try to understand how this token completed its bullish setup and how it has competed another setup for more powerful bullish rally.
Down channel and synchronized move of price action with indicators:
Since August 2019 the price action of IOTEX was moving in a down channel and this move on was very much synchronized with some indicators: the Momentum, Stochastic and moving average convergence divergence MACD indicator. If we take closer look at the chart then we notice that 1st the price action reached at the support and the momentum indicator turns bluish and the stochastic gave bull cross from the oversold zone and MACD also turned bullish and priceline of IOTX started more than 124% rally. And in the month of October 2019 the price action again reached at the support then we again receive the bullish indications by the same signals and this time the IOTEX produced more than 29% bullish rally.
In December 2019 IOTX received the same bullish signals by these indicators this time the priceline did not reach up to the support and it was moving sideways at the middle of this channel. And from here the priceline moved up and produced more than 55% gains. Then the priceline again dropped at the support in the month of March 2019. And we can observe the same bullish signals by the stochastic, Momentum and MACD indicators in the last week of March then again price action turned strong bullish and produced more than 200% bullish rally. This time the price line of IOTX produced most powerful rally because the IOTX announced the launch of mainnet on 1st June 2020.
Moon phase and Bollinger bands:
On the same daily chart I have also placed the Moon phase indicator and on the chart it can be seen that above the price line are the full moons and below the priceline are the dark moons. The distance from one full moon to another full moon and from one dark moon to another dark moon is called synodic cycle. And this synodic cycle is 29.5 days long. Before the recent strong bullish move we can see that recent full moon was appeared below the resistance of the channel. And the dark moon was a appeared below the support of this down channel that was bearish signal and it was indicating that the pipeline will be not able to break out the resistance of the channel. And if we see the position of the bollinger bands then it was also very sqeeze and it was also within the channel. Therefore IOTEX had another resistance before the resistance of the channel that was big hurdle for the price action to reach up to the resistance for the breakout.
But now after the recent strong bullish move the new moon is a appeared at very high altitude and the Bollinger bands is also moved above the resistance and stretched that is a clear indication that it is paving the way for the priceline for the breakout. Therefore it is expected that the next dark moon will be appeared above the support of the channel.
Support and resistance levels:
Now if we switch to the long term weekly chart to see the long-term support and resistance levels. Then after the bearish move of March 2020 the price action found a new support at 0.00000029 sats. And it is bounced from there and crossed up the next resistance level of 0.00000029 sats. Now the price action is moving sideways or it may re-test the previous resistance as a support and move to the next resistance level of 0.00000073 sats. Once the resistance of 0.00000073 sats will be broken out then upto 0.00000157 sats the priceline of IOTEX does not have any significant resistance between this area. Therefore from 0.00000073 to 0.00000157 sats the move can be rapid. And this move will be more than 115%.
Short term harmonic move:
On daily chart the priceline of IOTEX has formed a complete Gartley pattern and at this time the price action has entered in the potential reversal zone of this Gartley. After initial leg the nex leg that is A to B has been retraced between 0.618 0.786 Fib level that is the first confirmation of the Gartley pattern. Then the priceline is projected between 0.382 to 0.886 Fibonacci projection and this is a projection of A to B leg. And this is the second confirmation of Gartley. Now finally the price action has again retraced between 0.618 to 0.786 Fibonacci level and after this retracement the Gartley pattern is confirmed. Therefore as per Fibonacci sequence the buying and sell targets can be as below:
Buy between: 0.00000049 to 0.00000039 sats
Sell between: 0.00000057 to 0.00000077 sats.
so this Gartley can produce upto 97% big bullish move. However if the priceline will be able to cross up the 0.786 Fibonacci projection then it can turn even more bullish.
Long term harmonic move:
On the long-term weekly chart the price action of IOTX has completed the formation of very big bullish butterfly pattern. After initial leg the A to B leg is retraced between 0.618 to 0.786 Fibonacci level. Then B to C leg is projected between 0.382 to 0.886 Fibonacci projection. And this is the projection of A to B leg. Then finally the price action has been retraced between 1.27 to 1.618 Fibonacci retracement and at this time the price line is moving within potential reversal zone of this butterfly. Here I would like to tell you that on the chart if we observe then 1.618 level goes in the negative zone and it is not possible for the priceline to enter in the negative price level. Therefore the potential reversal zone is from 0.00000062 sats to 0.00000001 sats, but it doesn't mean that I am giving you a suggestion to buy within this potential reversal zone and set your stop loss at 0.00000001 sats as it can be a big loss. As we have seen that the recent support of the price line is 0.00000029 sats therefore we can buy within the potential reversals zone and set our stop loss at 0.00000029 sats. Now as per Fibonacci sequence of bullish butterfly and the recent support level the buying in sell targets can be as below:
Buy between: 0.00000062 to 0.00000029 sats
Sell between: 0.00000167 to 0.00000344 sats
So as per above targets the IOTEX has potential to
produce up to 1000% big gains.
Conclusion:
Even after producing more than 200% rally the price action has again completed the bullish setup for the next strong bullish rally on the short time and on the long term as well.
Note: This idea is education purpose only and not intended to be investment advice, please seek a duly licensed professional and do you own research before any investment.


IOTEX Breakout!Guten Morgen,
hier ein weiterer interessanter Coin mit einem Interessanten Projekt Namens "internet of trusted things".
Der Verkaufstrend ist gebrochen, der Rücksetzer kann durchaus als Pullback gewertet werden.
Ich sehe hier erstmal eine Trendfortsetzung long.
Happy Trading :)


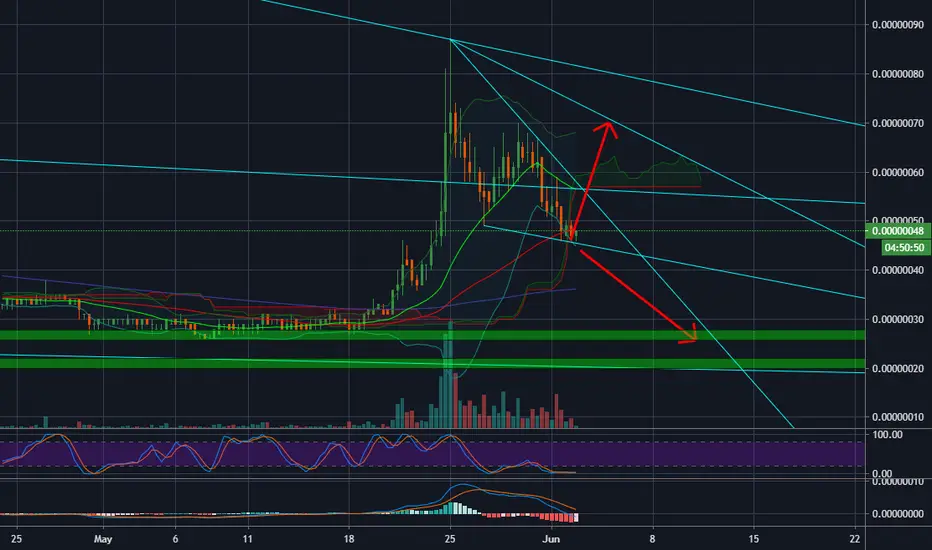
#IOTX/BTC (June 03)IOTX has a small support zone at 44-46sts. This zone may push it up back to 57sts or even 70sts in next days. So hold it tight if it is still higher than 42sts
If 42sts can't stop this drop, it will have a massive dump to 2 zones : 26-28sts and even 20-22sts
IOTX/BTC LONGIOTX has a Mainnet launch coming up tomorrow and price looks like its gonna blast through the 68 sat resistance. It's a good buy for a good profit.
IOTXBTC Target 125 sats.

IOTX/BTC 4 HR, BAT PATTERN, BULL DIV, 50-63%In addition to the title, Binance just released some FOMO news. binance.zendesk.com
I AM NOT A FINANCIAL ADVISER, DO YOUR OWN RESEARCH!


Mainnet launchClear ISHS here, IOTX is looking to launch their main net on the 1st of June.
Promising coin with fundamentals as well if you're interested in holding with potential for more upwards movement

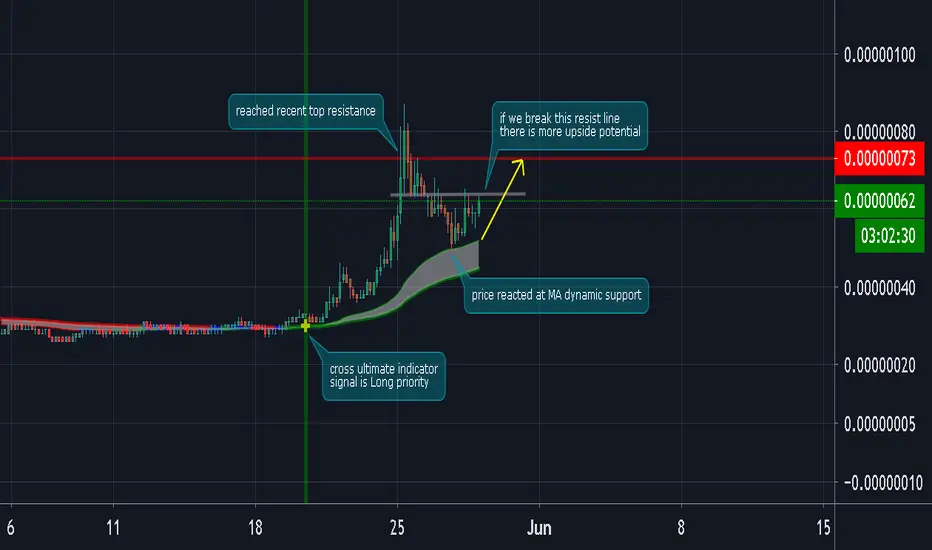
IOTX/BTC (Pullback at Key Moving Averages)IOTX/BTC
-cross ultimate indicator signal is Long priority last May 20
-the price pump over 180% and reached recent top resistance
-during pullback, it reacted on the MA dynamic support
-there is a local resist line at 65s
-if buyers come in and breaks this line
-we might experience another leg up continuation
IOTEX Potential 2xBuying these dips is wise as i see a C&H formed which has good R/R.
entry below 60 sats. Target according to fibs on chart.


BUY IOTXBTCIOTX looks good. Trend line resistance break out and bouncing from a daily support.
Targets are indicated on the chart.

Potencial of 150%Attention to this break breaking the trend line since Jun 2019, with great potential.
RSI controlled by bulls 63.5
MACD Bullish


IOTX/BTC | BullishLooking from a a bullish move for the next few candles , which can lead to a higher high and give us a higher target. Lets see how it plays out

IoTeX Takes Off, Will It Go Higher?IoTeX (IOTXBTC) on Binance is starting to move, right now prices are challenging MA200 (black line).
Now, will it go higher?
Looking at the strong action the other altcoins are printing, huge growth, it is very likely that IOTXBTC can also do more.
It is good to play it safe and secure profits on the way up.
Follow your strategy...
Enjoy the results.
Namaste.

IOTX | Breaking the Major Resistance..!!#IOTX/BTC (Update)
Breaking the Major Resistance (38 sats), Next Stop Would be 50+ Sats.
MainNet Launching Ahead (1st June 2020)
Please like the idea for Support & Subscribe for More ideas like this and share your ideas and charts in Comments Section..!!
Thanks for Your Love & Support..!

#IOTX - Huge Falling Wedge is working!Here is the falling wedge. Moreover, from the fundamental side there is a Mainnet launch at the first of June. Theta and TFuel pumped hard thanks to the such news.
Entering now and after descending resistance breakout. Targets are on the chart
