Indra Strengthens Its Defense Leadership Indra Strengthens Its Defense Leadership Amid Talent Exodus from Santa Bárbara
By Ion Jauregui – Analyst at ActivTrades
Indra has intensified its commitment to the defense sector with a strategic move that marks a turning point in the Spanish industry: the recruitment of more than 15 executives
Indra Sistemas SA
No trades
Next report date
—
Report period
—
EPS estimate
—
Revenue estimate
—
2.57 USD
287.32 M USD
5.01 B USD
85.78 M
About Indra Sistemas, S.A. Class A
Sector
Industry
CEO
Jose Vicente de los Mozos
Website
Headquarters
Alcobendas
Founded
1992
IPO date
Mar 8, 1999
Identifiers
2
ISIN ES0118594417
Indra Sistemas SA operates as a holding company, which engages in providing information technology products and services. It operates through the following business segments: Defence, Air Traffic, and Mobility. The Defence segment provides development of radars, air defense, and on-board systems for air and naval platforms. The Air Traffic segment offers programs to air traffic managements in Europe. The Mobility segment deals with the development of ticketing solutions, railway management systems and program for urban and interurban traffic management. The company was founded in 1992 and is headquartered in Alcobendas, Spain.
Related stocks

Indra Secures 100% of Spanish Defense CreditsIon Jauregui – Analyst at ActivTrades
The Indra Group (AIR.MC) has become the major player in the Spanish defense sector by securing the entirety of the new €4.7 billion loans that the Ministry of Industry and Tourism will allocate to ten Special Modernization Programs (PEM). These funds, granted a
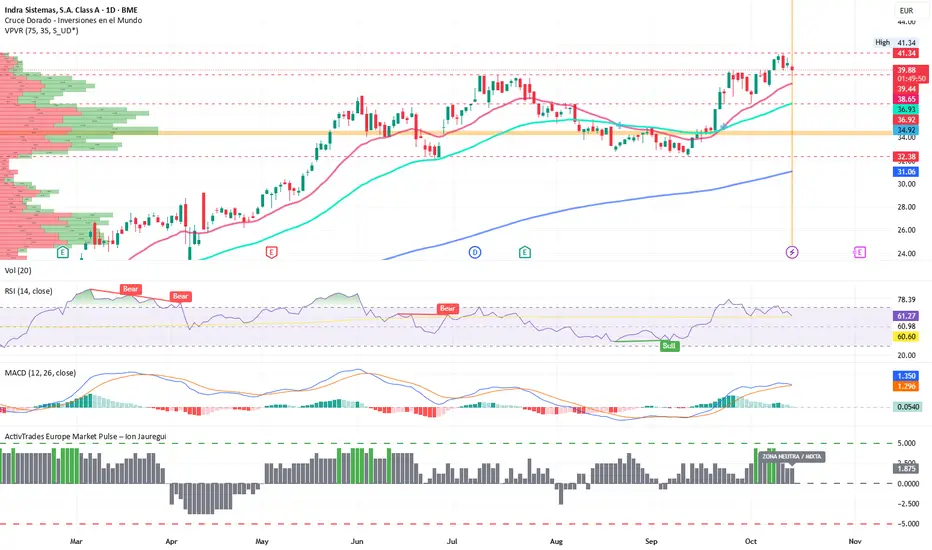
Indra future predictionOn this chart, we can see a stock with bull trading behavior.
The next resistance appears to be at 11,025, so we can gain up to 15%.
We crossed the MMA200 positively, and the MM20 and MM50 are moving up, significantly apart keeping their distance.
However we are far away from the MM20 moving avera

Indra: A Head and Shoulders may drag the stock price to 6.41€My previous analysis told to enter IDR when it reached 6.81-7€ level. However, the shape of a Head & Shoulders pattern has been confirmed today in H4 graph and we might experience further losses on the stock price, up to 6.41€ (lower bound of the slightly bearish channel it is forming).

Indra: Seizing sideways momentum call opportunity?Indra is moving inside a lateral channel with a slight bearish trend. In the last days there have been good news about projects that are being signed (i.e. Defense, Ireland) but it looks like global pandemic situation is making investors undecisive whether to hold positions on the stock or withdraw.


See all ideas
Summarizing what the indicators are suggesting.
Neutral
SellBuy
Strong sellStrong buy
Strong sellSellNeutralBuyStrong buy
Neutral
SellBuy
Strong sellStrong buy
Strong sellSellNeutralBuyStrong buy
Neutral
SellBuy
Strong sellStrong buy
Strong sellSellNeutralBuyStrong buy
An aggregate view of professional's ratings.
Neutral
SellBuy
Strong sellStrong buy
Strong sellSellNeutralBuyStrong buy
Neutral
SellBuy
Strong sellStrong buy
Strong sellSellNeutralBuyStrong buy
Neutral
SellBuy
Strong sellStrong buy
Strong sellSellNeutralBuyStrong buy
Displays a symbol's price movements over previous years to identify recurring trends.
Frequently Asked Questions
The current price of ISMAF is 61.36 USD — it has increased by 5.49% in the past 24 hours. Watch Indra Sistemas SA stock price performance more closely on the chart.
Depending on the exchange, the stock ticker may vary. For instance, on OTC exchange Indra Sistemas SA stocks are traded under the ticker ISMAF.
ISMAF stock has risen by 4.35% compared to the previous week, the month change is a −5.19% fall, over the last year Indra Sistemas SA has showed a 251.53% increase.
We've gathered analysts' opinions on Indra Sistemas SA future price: according to them, ISMAF price has a max estimate of 89.02 USD and a min estimate of 56.98 USD. Watch ISMAF chart and read a more detailed Indra Sistemas SA stock forecast: see what analysts think of Indra Sistemas SA and suggest that you do with its stocks.
ISMAF reached its all-time high on Jan 30, 2026 with the price of 67.35 USD, and its all-time low was 6.50 USD and was reached on Feb 3, 2003. View more price dynamics on ISMAF chart.
See other stocks reaching their highest and lowest prices.
See other stocks reaching their highest and lowest prices.
ISMAF stock is 5.21% volatile and has beta coefficient of 0.34. Track Indra Sistemas SA stock price on the chart and check out the list of the most volatile stocks — is Indra Sistemas SA there?
Today Indra Sistemas SA has the market capitalization of 10.64 B, it has increased by 3.02% over the last week.
Yes, you can track Indra Sistemas SA financials in yearly and quarterly reports right on TradingView.
Indra Sistemas SA is going to release the next earnings report on Feb 26, 2026. Keep track of upcoming events with our Earnings Calendar.
ISMAF earnings for the last quarter are 0.52 USD per share, whereas the estimation was 0.54 USD resulting in a −4.76% surprise. The estimated earnings for the next quarter are 0.82 USD per share. See more details about Indra Sistemas SA earnings.
Indra Sistemas SA revenue for the last quarter amounts to 1.36 B USD, despite the estimated figure of 1.43 B USD. In the next quarter, revenue is expected to reach 2.03 B USD.
ISMAF net income for the last quarter is 89.89 M USD, while the quarter before that showed 183.14 M USD of net income which accounts for −50.92% change. Track more Indra Sistemas SA financial stats to get the full picture.
Yes, ISMAF dividends are paid annually. The last dividend per share was 0.24 USD. As of today, Dividend Yield (TTM)% is 0.40%. Tracking Indra Sistemas SA dividends might help you take more informed decisions.
Indra Sistemas SA dividend yield was 1.19% in 2024, and payout ratio reached 12.82%. The year before the numbers were 1.45% and 17.32% correspondingly. See high-dividend stocks and find more opportunities for your portfolio.
As of Feb 14, 2026, the company has 60.91 K employees. See our rating of the largest employees — is Indra Sistemas SA on this list?
EBITDA measures a company's operating performance, its growth signifies an improvement in the efficiency of a company. Indra Sistemas SA EBITDA is 681.42 M USD, and current EBITDA margin is 10.71%. See more stats in Indra Sistemas SA financial statements.
Like other stocks, ISMAF shares are traded on stock exchanges, e.g. Nasdaq, Nyse, Euronext, and the easiest way to buy them is through an online stock broker. To do this, you need to open an account and follow a broker's procedures, then start trading. You can trade Indra Sistemas SA stock right from TradingView charts — choose your broker and connect to your account.
Investing in stocks requires a comprehensive research: you should carefully study all the available data, e.g. company's financials, related news, and its technical analysis. So Indra Sistemas SA technincal analysis shows the buy rating today, and its 1 week rating is buy. Since market conditions are prone to changes, it's worth looking a bit further into the future — according to the 1 month rating Indra Sistemas SA stock shows the buy signal. See more of Indra Sistemas SA technicals for a more comprehensive analysis.
If you're still not sure, try looking for inspiration in our curated watchlists.
If you're still not sure, try looking for inspiration in our curated watchlists.