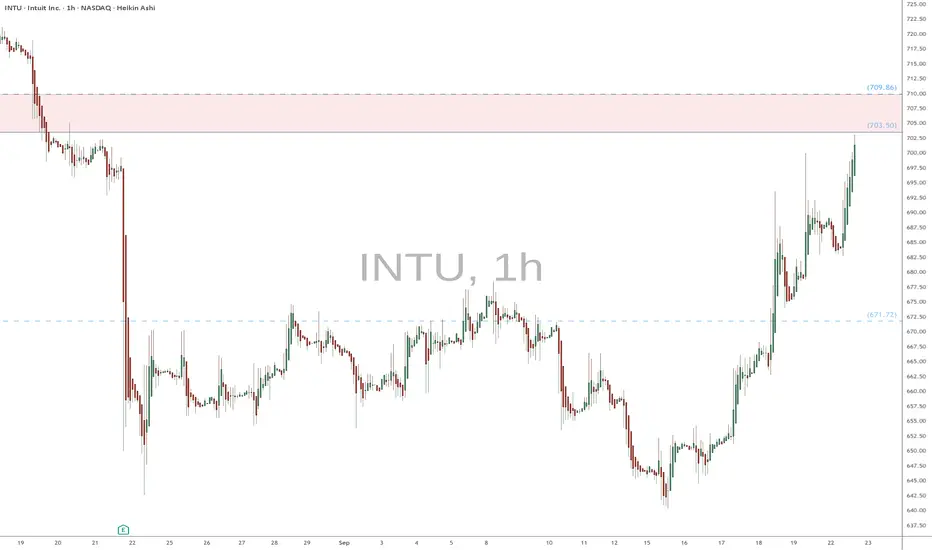
INTU heads up at $703 then 709: Resistance Zone bulls MUST breakINTU trying to paint a bottom after earnings drop.
Currently testing a key resistance $703.50-709.86
Look for a Dip-to-Fib or Break-n-Retest for entries.
.
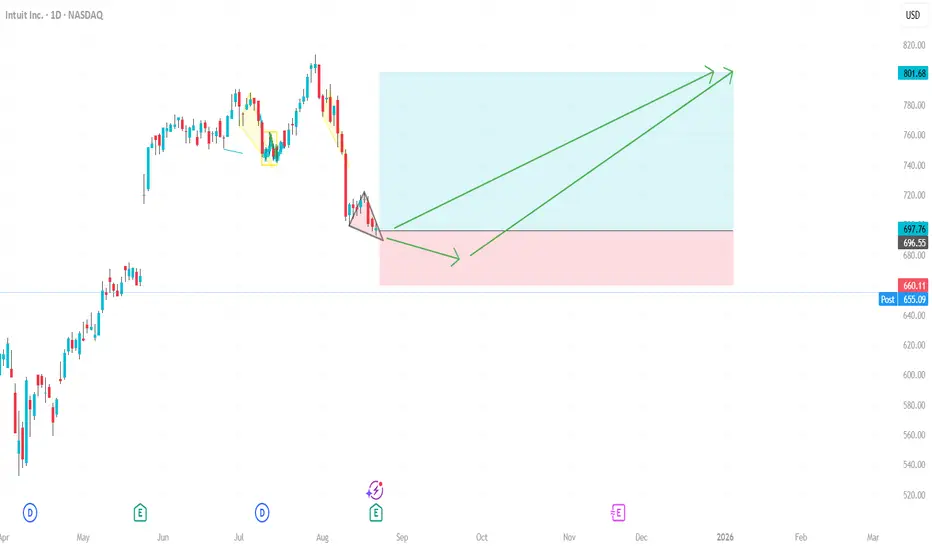
Previous Analysis that caught the PERFECT BOTTOM:
Hit BOOST and FOLLOW for more such PRECISE and TIMELY charts.
============================
Next report date
—
Report period
—
EPS estimate
—
Revenue estimate
—
12.11 EUR
3.39 B EUR
16.50 B EUR
272.19 M
About Intuit Inc.
Sector
Industry
CEO
Sasan K. Goodarzi
Website
Headquarters
Mountain View
Founded
1983
ISIN
US4612021034
FIGI
BBG00FZMF7J7
Intuit, Inc. engages in the provision of business and financial management solutions. It operates through the following segments: Small Business and Self-Employed, Consumer, Credit Karma, and ProTax. The Small Business and Self-Employed segment offers QuickBooks financial and business management online services and desktop software, payroll solutions, payment processing solutions, and financing for small businesses. The Consumer segment includes do-it-yourself and assisted TurboTax income tax preparation products and services. The Credit Karma segment serves consumers with a personal finance platform that provides personalized recommendations of credit cards, home, auto and personal loans, and insurance products, and online savings and checking accounts. The ProTax segment refers to the professional accountants in the U.S. and Canada, who are essential to both small business success and tax preparation and filing. The company was founded by Scott D. Cook and Thomas A. Proulx in March 1983 and is headquartered in Mountain View, CA.
Related stocks
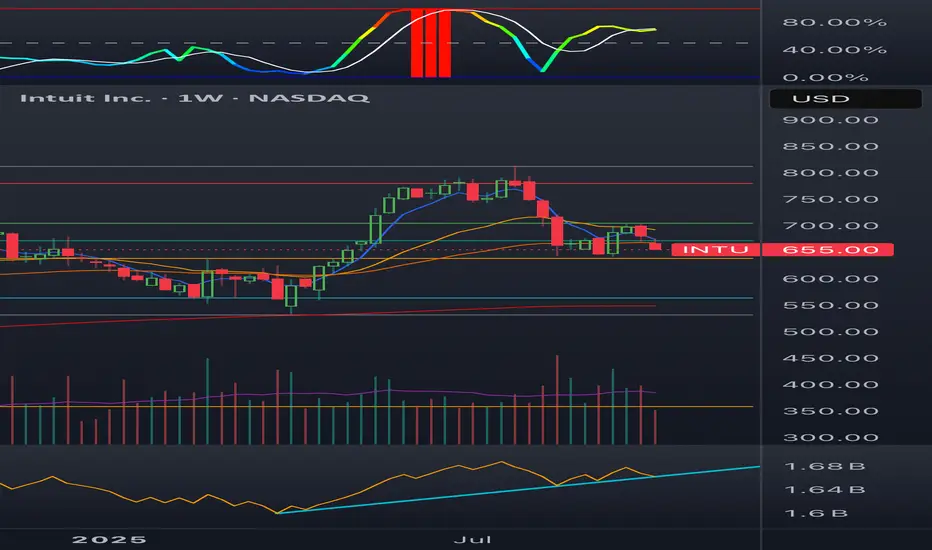
Intu long golden pocket Intu should be an exceptional rate play here. We saw a nice correction. They own quickbooks , turbo tax, and credit karma. We are in the weekly golden pocket on broken momentum.
My plan :
Around now is the time to buy before rates drop further , their margins should increase here.

Intu long INTU finds itself in the golden pocket after a nice pump. This stock will do really well as rates drop. Golden pockets have been one of my main trading strategies, this setup looks like the rest.
I would not be surprised if we see a test of 800$ in a few weeks to months
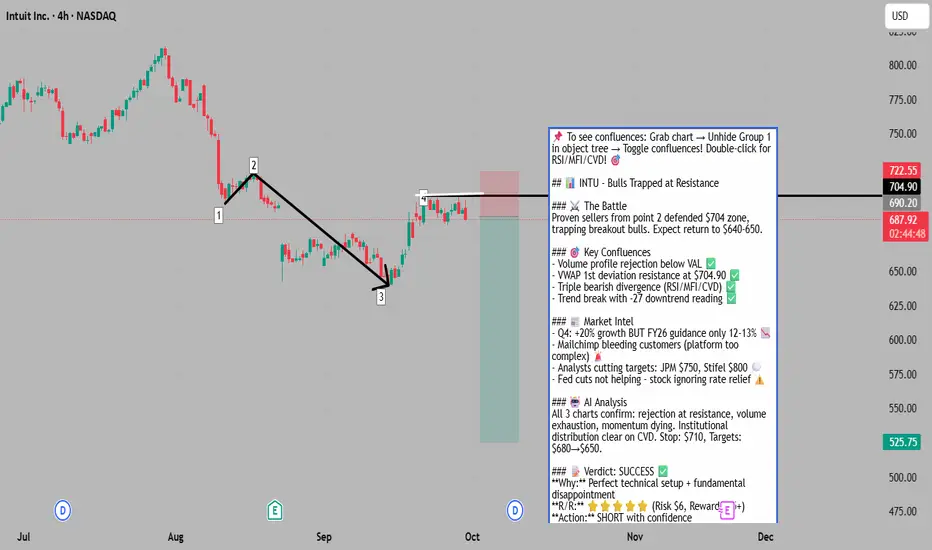
Bulls Cornered at Vanguard - Bears Prime for Attack📌 To see my confluences and/or linework: Step 1: Grab chart 📊, Step 2: Unhide Group 1 in object tree 🌲, Step 3: Hide and unhide specific confluences one by one ✨. Also, double-click the screen to show RSI, MFI, CVD, and OBV indicators alongside divergence markings! 🎯
⚔️ The Market Participant Ba
A dive into INTU (Intuit Inc.) seasonality and fractal analysisinto <> intu .... haha. me funny dude...
Here you can see my prjection for the price upmove.
It is based on seasonality which should give us some positive boost with high propability for the rest of the year.
In addition I how to have identified 2 fractals correctly which support the idea of an u
Trend Score Daily Review (9-5-25) $UNH $BX $HDHere are 10 stocks found in the trend score HTR raw data pine screener as confirmed bullish on Sep 5th 2025.
BX CDW HD INTU LEN MTCH NCLH SWK UNH WSM
Market Review: BX, CDW, HD, INTU, LEN, MTCH, NCLH, SWK, UNH, WSM
These ten companies represent a cross-section of the U.S. economy

$INTU cross-selling strategy is not working as expected.- An integrated strategy across mailchimp <-> Quickbooks <-> Credit Karma <-> Turbotax
- It's taking longer than usual, cross-selling and networking effect between platform isn't meaningful despite lot of efforts.
- Valuation has always been rich but law of large number is coming to bite them. Earn
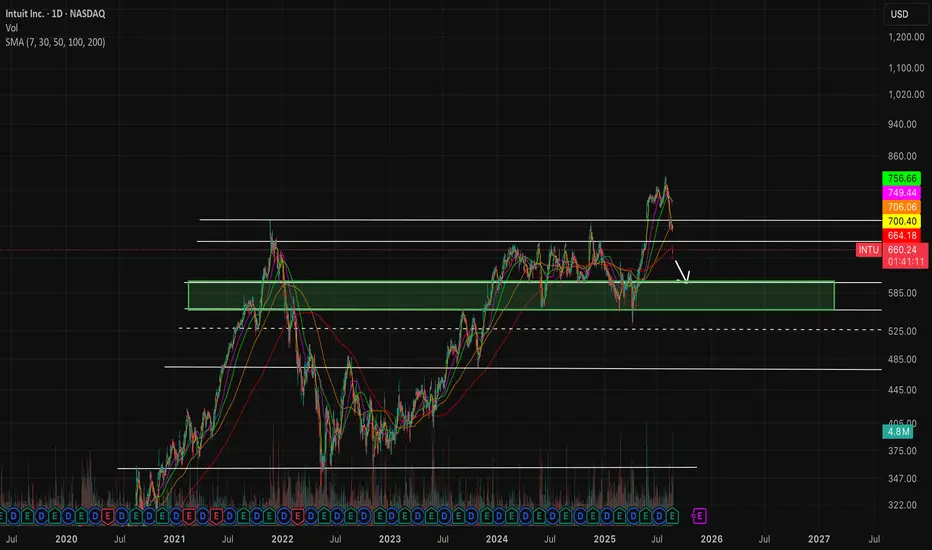
INTUIT: Strategic Opportunity After Multi-Year Resistance BreaKINTUIT: A Strategic Opportunity After Multi-Year Resistance Break
First Impressions: Standing at a Critical Decision Point
Looking at these Intuit chart, I get that familiar feeling every investor knows, am I looking at opportunity or danger?
After years of testing a massive resistance zone a

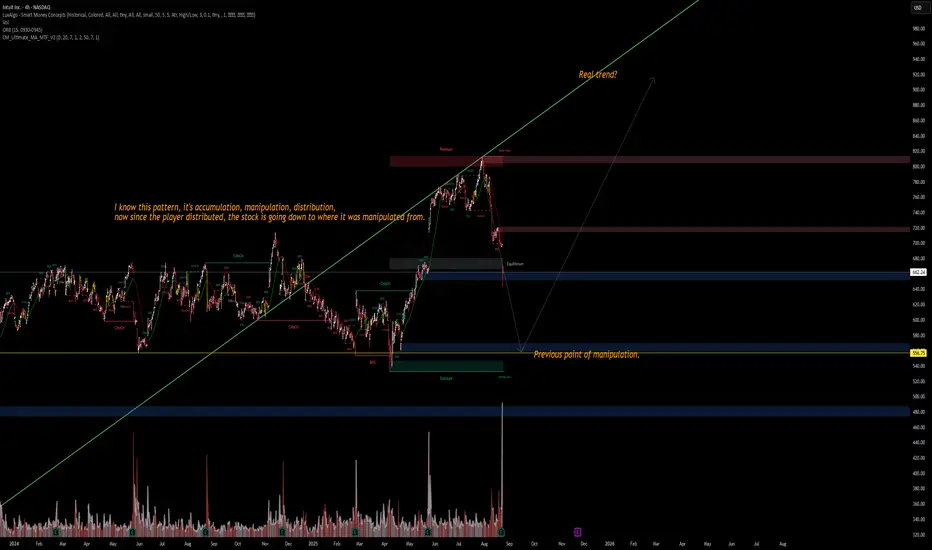
INTU – Market Structure Breakdown📉 INTU – Market Structure Breakdown
I recognize this setup:
Accumulation ➝ Manipulation ➝ Distribution.
After distribution at the premium zone, price is now breaking down toward the previous point of manipulation.
🔹 Current price: ~662
🔹 Potential downside target: 556–560 zone (previous manipulat
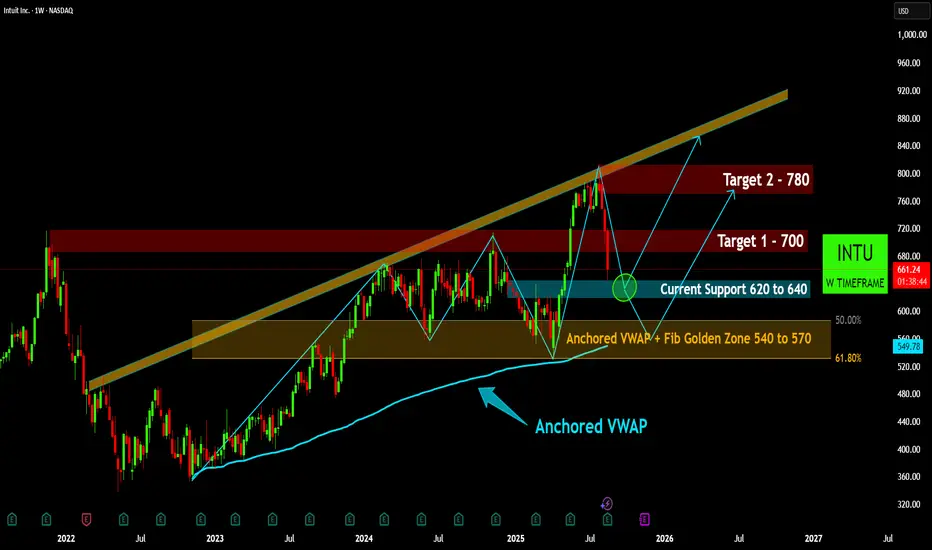
INTU Weekly: Testing Critical Support within Long-Term UptrendINTU Weekly: Testing Critical Support within Long-Term Uptrend
INTU demonstrates a robust long-term bullish trend, consistently trading within an upward-sloping channel on the weekly timeframe since early 2023.
Following a recent peak, the stock is currently testing the "Current Support" zone
See all ideas
Summarizing what the indicators are suggesting.
Neutral
SellBuy
Strong sellStrong buy
Strong sellSellNeutralBuyStrong buy
Neutral
SellBuy
Strong sellStrong buy
Strong sellSellNeutralBuyStrong buy
Neutral
SellBuy
Strong sellStrong buy
Strong sellSellNeutralBuyStrong buy
An aggregate view of professional's ratings.
Neutral
SellBuy
Strong sellStrong buy
Strong sellSellNeutralBuyStrong buy
Neutral
SellBuy
Strong sellStrong buy
Strong sellSellNeutralBuyStrong buy
Neutral
SellBuy
Strong sellStrong buy
Strong sellSellNeutralBuyStrong buy
Displays a symbol's price movements over previous years to identify recurring trends.
INTU5651455
Intuit Inc. 5.5% 15-SEP-2053Yield to maturity
5.46%
Maturity date
Sep 15, 2053
INTU5651458
Intuit Inc. 5.2% 15-SEP-2033Yield to maturity
4.54%
Maturity date
Sep 15, 2033
INTU5008438
Intuit Inc. 1.65% 15-JUL-2030Yield to maturity
4.16%
Maturity date
Jul 15, 2030
INTU5651456
Intuit Inc. 5.25% 15-SEP-2026Yield to maturity
4.01%
Maturity date
Sep 15, 2026
INTU5651457
Intuit Inc. 5.125% 15-SEP-2028Yield to maturity
3.92%
Maturity date
Sep 15, 2028
INTU5008437
Intuit Inc. 1.35% 15-JUL-2027Yield to maturity
3.82%
Maturity date
Jul 15, 2027
See all ITU bonds
Curated watchlists where ITU is featured.


Frequently Asked Questions
The current price of ITU is 575.20 EUR — it has increased by 0.16% in the past 24 hours. Watch Intuit Inc. stock price performance more closely on the chart.
Depending on the exchange, the stock ticker may vary. For instance, on GETTEX exchange Intuit Inc. stocks are traded under the ticker ITU.
ITU stock has fallen by −1.15% compared to the previous week, the month change is a −1.00% fall, over the last year Intuit Inc. has showed a 1.29% increase.
We've gathered analysts' opinions on Intuit Inc. future price: according to them, ITU price has a max estimate of 845.70 EUR and a min estimate of 522.58 EUR. Watch ITU chart and read a more detailed Intuit Inc. stock forecast: see what analysts think of Intuit Inc. and suggest that you do with its stocks.
ITU stock is 0.77% volatile and has beta coefficient of 0.60. Track Intuit Inc. stock price on the chart and check out the list of the most volatile stocks — is Intuit Inc. there?
Today Intuit Inc. has the market capitalization of 160.37 B, it has increased by 3.77% over the last week.
Yes, you can track Intuit Inc. financials in yearly and quarterly reports right on TradingView.
Intuit Inc. is going to release the next earnings report on Nov 20, 2025. Keep track of upcoming events with our Earnings Calendar.
ITU earnings for the last quarter are 2.41 EUR per share, whereas the estimation was 2.33 EUR resulting in a 3.35% surprise. The estimated earnings for the next quarter are 2.68 EUR per share. See more details about Intuit Inc. earnings.
Intuit Inc. revenue for the last quarter amounts to 3.36 B EUR, despite the estimated figure of 3.28 B EUR. In the next quarter, revenue is expected to reach 3.26 B EUR.
ITU net income for the last quarter is 333.74 M EUR, while the quarter before that showed 2.49 B EUR of net income which accounts for −86.60% change. Track more Intuit Inc. financial stats to get the full picture.
Yes, ITU dividends are paid quarterly. The last dividend per share was 1.04 EUR. As of today, Dividend Yield (TTM)% is 0.65%. Tracking Intuit Inc. dividends might help you take more informed decisions.
Intuit Inc. dividend yield was 0.53% in 2025, and payout ratio reached 30.43%. The year before the numbers were 0.56% and 34.51% correspondingly. See high-dividend stocks and find more opportunities for your portfolio.
As of Nov 5, 2025, the company has 18.2 K employees. See our rating of the largest employees — is Intuit Inc. on this list?
EBITDA measures a company's operating performance, its growth signifies an improvement in the efficiency of a company. Intuit Inc. EBITDA is 5.03 B EUR, and current EBITDA margin is 30.52%. See more stats in Intuit Inc. financial statements.
Like other stocks, ITU shares are traded on stock exchanges, e.g. Nasdaq, Nyse, Euronext, and the easiest way to buy them is through an online stock broker. To do this, you need to open an account and follow a broker's procedures, then start trading. You can trade Intuit Inc. stock right from TradingView charts — choose your broker and connect to your account.
Investing in stocks requires a comprehensive research: you should carefully study all the available data, e.g. company's financials, related news, and its technical analysis. So Intuit Inc. technincal analysis shows the sell today, and its 1 week rating is sell. Since market conditions are prone to changes, it's worth looking a bit further into the future — according to the 1 month rating Intuit Inc. stock shows the buy signal. See more of Intuit Inc. technicals for a more comprehensive analysis.
If you're still not sure, try looking for inspiration in our curated watchlists.
If you're still not sure, try looking for inspiration in our curated watchlists.