JASMY price pattern analysisIt is about reading the price pattern and the result of the indicators
I will only share with you what the result of the analysis shows.
This could be wrong. MD
JASMYUSDT trade ideas

JASMY's Situation: What Shall we ExpectHi.
BINANCE:JASMYUSDT
As you can see, the price is in the ascending channel and has reached the ceiling of the channel and now we are correcting the price to the PRZ zone, then the price can grow well.
❗ Note that if the Triangle is broken down with the power of descending candles, our analysis will fail.
Traders, if you liked this idea or have your opinion on it, write in the comments, We will be glad.
Previous Analysis
_ _ _ _ __ _ _ _ _ _ _ _ _ _ _ _ _ _ _ _ _ _ _ _ _ _ _ _ _ _ _ _
✅Thank you, and for more ideas, hit ❤️Like❤️ and 🌟Follow🌟!
⚠️Things can change...
The markets are always changing and even with all these signals, the market changes tend to be strong and fast!!

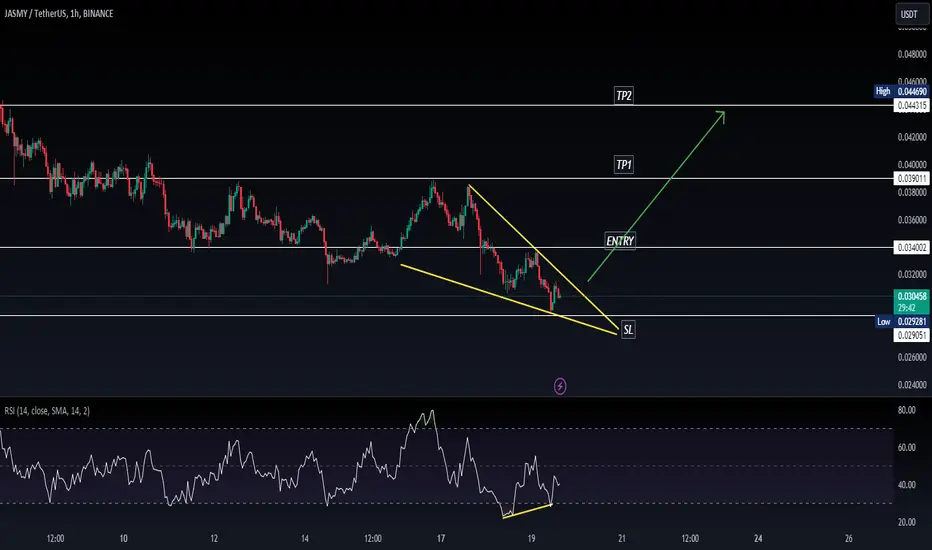
JASMY short setup ALL trading ideas have entry point + stop loss + take profit + Risk level.
hello Traders, here is the full analysis for this pair, let me know in the comment section below if you have any questions, the entry will be taken only if all rules of the strategies will be satisfied. I suggest you keep this pair on your watchlist and see if the rules of your strategy are satisfied. Please also refer to the Important Risk Notice linked below.
Disclaimer

JASMYUSDT BUY NOW!!!!!!!!!!!!!!!!!!!JASMY Completed my last analysis predictions now price just sweep liquidity at my fvg zone am expecting a quick recovery to the buy side for a breakouts in the price of jasmy coin
Am currently on long from this point
JOIN AND ENJOY...............

Jasmy Price predictionDear Traders,
i see jasmy on weekly going up to theese targets but from now to 1 week it may dump to 18 20 where it was before

JASMYUSDT: Bullish TrendIn my previous analysis JASMY is formed H&S Pattern and moved in bearish trend, Now JASMY is forming LLs and LHs, but on the 1hr time frame there is a strong bullish divergence, if JASMY break the previous LHs so that is a bullish sign and we can take a new long trade on the break of the LHs.

Jasmy 4HR BLOOD Diamond. Does it Print?A 4HR blood Diamond is trying to print for Jasmy. If this diamond can print, I'm looking for movement to the downside, clearing vector zone and hitting the golden pocket fib

JASMYUSDT: Bearish Trend (H&S Pattern) JASMYUSDT is moving in down trend and currently formed perfect Head & Shoulder Pattern on 4hr time frame, and also break the nick line and previous LLs that is confirmation of the bearish trend so we can take a short entry on current market price or mention entry price in the chart.

JASMYUSDTJASMYUSDT is in reversal mode.
Bullish divergence also shown in RSI.
We wait and watch for the breakout of last LH.
JASMYUSDT BUY NOW 0.044 SOON!!!!!!!!!!!!!JASMY completed three targets from my sell entry now we got a breakouts from the buy side of the falling wedge am waiting for the retest for a buys because price is heading to sweep or run liquidity above 0.044
TELL US YOUR VIEWS ON JASMY

"Analysis of JASMY: Upward movement against the market trend"💹 Let's dive into updating our analysis of JASMY coin. We'll review our previous triggers and entry points and examine new opportunities for profitable trades.
🗣️ Market Overview:
Before diving into the JASMY analysis, let's discuss the recent events in the market. Yesterday, the crypto market began to decline after the U.S. non-farm payroll data for May came in much stronger than expected. This data indicated that the labor market is handling tight monetary policies better than anticipated. Consequently, this diminished the likelihood of the Federal Reserve lowering interest rates, which is a crucial factor for the influx of liquidity into risky assets and cryptocurrencies. As a result, the chance of a rate cut in July was effectively eliminated, leading Bitcoin to drop to $68,400 last night and causing $450 million in trading positions to be liquidated.
🔍 Previous Analysis Recap:
In our previous analysis, we focused on a long position and identified the significant resistance at 0.024489. After breaking this resistance, we expected a bullish move, although we also anticipated a potential bounce from the parabolic curve, which did not occur. Instead, after ranging within the box and breaking out of the box's top, the price started its upward movement.
🕵️♂️ I personally opened a long position after the breakout at 0.024489, following the trigger provided. It wasn't just a theoretical trigger; it was a practical trading opportunity. To talk about the entry point, the resistance broke with strong buying pressure, indicated by the shadows at the bottom, showing sellers tried to hold the price down but couldn't. The volume also increased. Currently, I'm holding this position, but if we close below 0.037890 on the 4-hour timeframe, I will close the position. So far, this trade has a risk-to-reward ratio of 6.5.
📊 Weekly Timeframe:
On the weekly timeframe, after breaking out of a significant 500-day box and the weekly resistance at 0.007311, we have started a bullish movement. The importance of these boxes cannot be overstated; they are crucial for trading strategies, especially for buying altcoins or forming a crypto portfolio. Unlike shopping in a store, you shouldn't just pick a little of everything. You need triggers, and these boxes and the relative performance to Bitcoin are essential.
💰 Our volume analysis on the weekly timeframe confirms the uptrend as volumes increase with green candles in the direction of the trend and decrease during ranging and corrections, indicating the trend's strength.
⏳ Daily Timeframe:
On the daily timeframe, we have a clear uptrend. After breaking the resistance at 0.024489 mentioned in our previous analysis, we saw an 80% move upwards. Currently, we have reached the significant daily resistance at 0.044029, which might slow down the price.
🛡️ Additionally, the RSI is in the overbought zone, suggesting the market might need some rest. We could form a box here, but it heavily depends on overall market conditions.
🕯️ Another useful tip is that in an uptrend, if there's a fake breakout below the box's bottom, the likelihood of breaking out of the top increases.
🌟 Four-Hour Timeframe:
In the four-hour timeframe, JASMY is moving contrary to the market trend. While most coins are ranging or declining due to last night's events, JASMY is rising because its Bitcoin pair (JASMYBTC) is bullish, attracting more buyers.
📈 For a long position , wait for the breakout above the 0.04429 resistance or the RSI to enter the overbought zone, breaking 73.69.
📉 For a short position , there are better coins that are more aligned with a downward trend. However, if you're keen on shorting JASMY, wait for a break of the ascending trendline and the activation of the trigger at 0.037890.
💡 One important point from my experience: When a coin is in a strong uptrend, even if there's a correction, it tends to bounce back more sharply compared to other coins. This makes it more likely to hit your stop loss if you're shorting.
🛒 Currently, there's no new entry point for buying this coin. However, the previous entry point at the breakout of 0.024489 remains valid and is already up by 70%. You can consider taking out your initial investment to be risk-free.
🔑 Key Support and Resistance Levels:
Supports: 0.037890, 0.032356, 0.024489
Resistances: 0.044029, 0.052533, 0.064612
😊 If you'd like me to analyze a specific coin or currency pair, be sure to comment so that I can allocate the next analysis for you!
⚠️ Also, please remember that I'm just an analyst, and this isn't financial advice . We're here to stay in the market and maximize profits by adhering to risk and capital management principles.

jasmy short setupjasmy short setup. We can see change of character here. so we will see drop to the previous buy order block.

JASMY ANALYSIS🔮As we said earlier, #JASMY performed same. Around 113% movement after we post our analysis.
Now we can see that there is a formation of "Falling Wedge Pattern" in #JASMY. Also there is a perfect breakout 👌 We will see a bullish move of around 20% in few days
#DYOR

Daily Bear Div, JasmyBear Div On the Daily, Jasmy Token! Money Flow is Down, Vwap is low and Momentum is down. I have two Take Profits areas using golden pocket fib. Long term play, If BTc falls this will play very nice! time will tell

JASMYUSDTAccording to the labeling that has been done and if it is correct, we can expect the start of an upward rally in the form of wave 5 of 3.. Spot buying around $0.0324 can be associated with less risk.

JASMY DAILY DEADLY BLOOD DIAMOND 1DAYNow this would be the ultimate short right here. 3TPs all ready and set. This will be an epic short thats for sure. I see a blood diamond on the one day. There is a huge bear div on momentum+money flow is down+rsi and Stochrsi about to drop below the 70 line. I see price moving into all fibs and clearing all vector zones on the way down. SUPER BEARISH! THIS IS A MUST WATCH

JASMSY SHORT GOING VERY WELL jasmy trade setup perfect short open . those who open short congratulations u are in big profit right now . every one saying that jasmy going to moon . u can check my comments about that .

JASMY USD LONG READY TO FLY TARGET 0.03500JASMY USDT RISE READY INVESTMENT
Long 0.018877
Tp1 0.02525
Tp2 0.03500
tp3 0.03900
Stop 0.012693

JASMYUSDT KEEP SELLING!!!!!!!!!!!Jasmy made a possible breakouts with multiple retest at 0.040 level we tighten our stoploss to 0.041 and closed over two measure targets now am expecting the price to break measure area at 0.033 to 0.029
JOIN AND ENJOY
Tell us your views.............

JASMYUSDT: Bullish TrendJASMYUSDT is moving perfect bullish trend and forming HHs and HLs, currently JASMY if formed strong bullish divergence on 1hr time frame, so this is another confirmation of the bullish tend so we will wait for the break of the pattern and take a long entry.

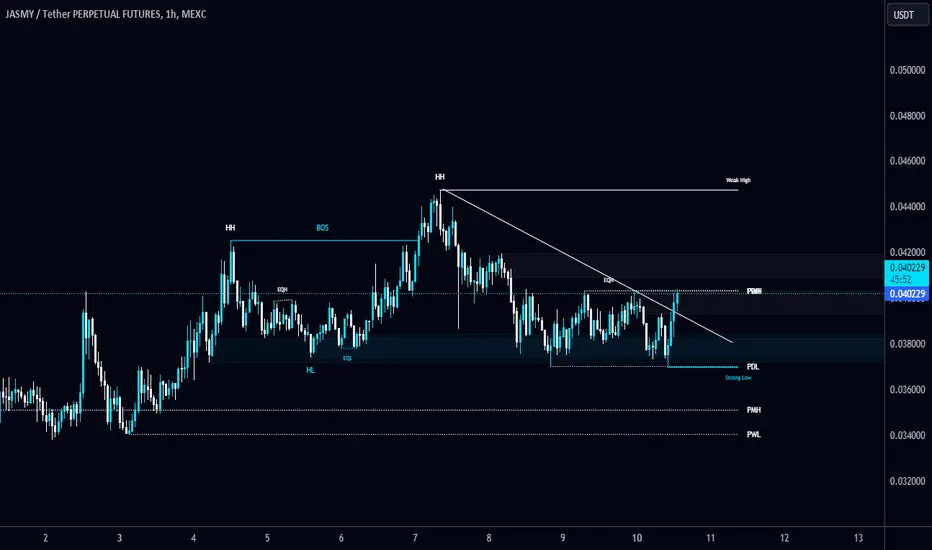
#JASMY/USDT breaks the Diagonal Trendline in 1-Hour TF!#JASMY/USDT breaks the Diagonal Trendline in 1-Hour TF!
SEED_DONKEYDAN_MARKET_CAP:JASMY looks bullish here and retested too. The local resistance level is $0.0447, and local support level is $0.036985.
$JASMY Bullish Pennent on daily and weekly TF !
Trading in a bullish pennant pattern involves recognizing the setup and then executing trades based on the pattern's characteristics. Here are three key points to consider:
### 1. Identify the Pattern
- **Formation**: A bullish pennant forms after a strong upward movement (flagpole), followed by a brief consolidation period with converging trendlines that create a small symmetrical triangle.
- **Volume**: The volume typically decreases during the consolidation phase and should increase upon breakout.
- **Duration**: This pattern usually develops over a period of one to three weeks.
### 2. Confirm the Breakout
- **Breakout Point**: Enter a trade when the price breaks above the upper trendline of the pennant with increased volume.
- **Validation**: Ensure the breakout is supported by higher trading volumes, which confirms the strength and likelihood of continuation.
- **Entry Strategy**: Place a buy order slightly above the breakout point to avoid false breakouts.
### 3. Manage the Trade
- **Target Price**: Estimate the target price by measuring the length of the flagpole (the initial price increase) and adding it to the breakout point.
- **Stop-Loss Order**: Place a stop-loss order below the lower trendline of the pennant to protect against downside risk.
- **Monitor**: Continuously monitor the trade, adjusting stop-loss levels to lock in profits as the price moves in your favor.
By following these steps, traders can effectively capitalize on the bullish pennant pattern and manage their risk appropriately.

JASMY/USDT SELL NOW!!!!!!!!!Jasmyusdt have been making an uptrends for days and now price just took out the sell side liquidity am expecting a minor retracement from the premium zone then sell off from there till 0.023947 is completed
JOIN AND ENJOY
Tell us what you think...................?
