CADJPY | Strong Resistance ZoneOANDA:CADJPY facing strong resistance at the shown level and a reversal expected. confluence of several trend lines and horizontal barriers has created a probable short opportunity imho.
We need to wait for price action to confirm this idea or not.
Good luck
JPYCAX trade ideas

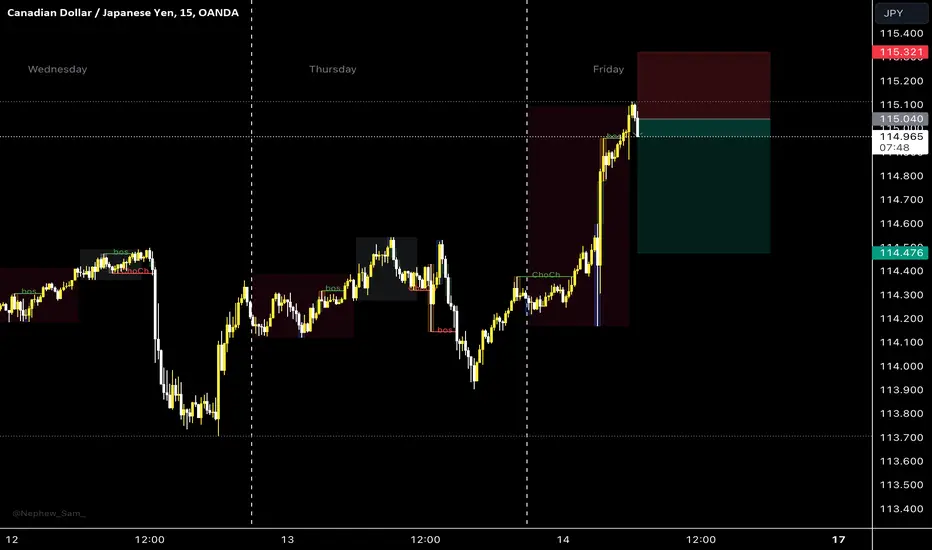
CADJPY: More Growth is Coming?!I have identified a strong bullish pattern on the 4-hour chart of CADJPY.
The pair has formed an ascending triangle pattern and has broken above its horizontal neckline.
This could signal a potential bullish move ahead. My targets for this trade are 114.96 and 115.51.

CADJPY: Bullish Continuation is Highly Probable! Here is Why:
It is essential that we apply multitimeframe technical analysis and there is no better example of why that is the case than the current CADJPY chart which, if analyzed properly, clearly points in the upward direction.
❤️ Please, support our work with like & comment! ❤️

AUDJPY → Trade Analysis | SELL SetupI have two options here.. bullish continuation from here or bearish break.. Potential BEARISH move!
Hello Traders, here is the full analysis.
I think we can soon see more fall from this range! GOOD LUCK! Great SELL opportunity AUDJPY
I still did my best and this is the most likely count for me at the moment.
Support the idea with like and follow my profile TO SEE MORE.
Traders, if you liked this idea or if you have your own opinion about it, write in the comments. I will be glad 🤝
Patience is the If You Have Any Question, Feel Free To Ask 🤗

Plan SELL CADJPY zone supplyI see a SELL opportunity in CADJPY with several sell setup considerations
1. There is a bearish flag or channel formation on the 4H TF.
2. DBD supply zone
With this consideration, we take a SELL setup if the price enters the supply zone.
Still consider trading risks.
Note: this setup is not trading advice. All risks are not our responsibility. Happy Trading

CADJPY What Next? SELL!
My dear subscribers,
My technical analysis for CADJPY is below:
The price is coiling around a solid key level - 114.80
Bias - Bearish
Technical Indicators: Pivot Points Low anticipates a potential price reversal.
Super trend shows a clear sell, giving a perfect indicators' convergence.
Goal - 114.37
About Used Indicators:
By the very nature of the supertrend indicator, it offers firm support and resistance levels for traders to enter and exit trades. Additionally, it also provides signals for setting stop losses
———————————
WISH YOU ALL LUCK

***** CADJPY UNIQUE IDEA *****#USDJPY
(UPDATE)
Hey traders we are here to update about USDJPY. USDJPY ready for big drop as volume getting low. In this drop we can see drop upto 200Pips+. Keep in touch we will update further soon.

CADJPY RUN DOWNResistance at 115 we can expect a head and shoulders formation at this Zone-support at 114 liquidity will be a good driver to attract price down
CADJPYBUY TRADE CALLFUNDAMENTAL:CAD LONG 22.46 SHORT 77.54 - JPY LONG 18.98 SHORT 81.02
SENTIMENTAL :CADJPY BUY 65.00 35.00
TECHNICAL :Price moving in bullish channel and there is formation of ascending triangle pattern no bearish divergence
ENTRY STOPLOSS LOSS TAKE PROFIT LEVELS MENTIONED IN THE CHART
TRADE AT YOUR RISK
GOOD LUCK

CAD/JPY SHORT FROM RESISTANCE
Hello,Friends!
CAD/JPY pair is in the uptrend because previous week’s candle is green, while the price is evidently rising on the 4H timeframe. And after the retest of the resistance line above I believe we will see a move down towards the target below at 113.500 because the pair overbought due to its proximity to the upper BB band and a bearish correction is likely.
✅LIKE AND COMMENT MY IDEAS✅

CADJPY BEARISH H1Rising Wedge H1
Double Top despite the spike caused by news for the first V of the M
Flag being formed in the M15 timeframe
Executing a risk entry once third touch of flag has been touched

CAD JPY PRICE - BACK TO RESISTANCE ZONE TO FILL THE LIQUIDITY HERE we can see that price tryed multiple times to break the resistance, we expect now price will fill the liquidity at resistance, make a long entry as shown, follow for more live updates...

Potential Short CAD/JPYIn daily time frame, today possible will generate a shooting star (not completed yet).
The price is closing to a long term up trend support line
MACD in 8 hours time fame has divergency. MACD retraced and touched pressure line and 0 level line.
Slow Stoch in 8 hours time frame is in over bought level and crossed.
Guppy in 8 hours time frame is contraction.
Try to open short order is the price break the short term up trend line to south.

CAD JPY PRICE - BUY MODE ON TARGET TO RESISTANCE ZONE CAD JPY we got an break out from down trend line, wait for the retest, make a long entry to resistance zone, follow for more live updates...

CADJPY is a longUnlike the other competing pairs trading again Japanese yen, . CADJPY tend not to move so aggressive as the others in its sector, this could either be because the Canadian dollars sector as no direct for the past few yours,
CADJPY accounting shown on the price action , and its financial view shows a 160pips growth in the features


CADJPY Trading Opportunity! BUY!
My dear friends,
Please, find my technical outlook for CADJPY below:
The instrument tests an important psychological level 114.06
Bias - Bullish
Technical Indicators: Supper Trend gives a precise Bullish signal, while Pivot Point HL predicts price changes and potential reversals in the market.
Target - 114.90
Recommended Stop Loss - 113.49
About Used Indicators:
Super-trend indicator is more useful in trending markets where there are clear uptrends and downtrends in price.
———————————
WISH YOU ALL LUCK

My Idea about CADJPYafter my analysis, I am waiting patiely for the price to get to this point, my pending order is already intact

Potential bullish rise?CAD/JPY has reacted off the pivot and could rise to the 1st resistance which is a pullback resistance.
Pivot: 113.02
1st Support: 111.66
1st Resistance: 114.23
Risk Warning:
Trading Forex and CFDs carries a high level of risk to your capital and you should only trade with money you can afford to lose. Trading Forex and CFDs may not be suitable for all investors, so please ensure that you fully understand the risks involved and seek independent advice if necessary.
Disclaimer:
The above opinions given constitute general market commentary, and do not constitute the opinion or advice of IC Markets or any form of personal or investment advice.
Any opinions, news, research, analyses, prices, other information, or links to third-party sites contained on this website are provided on an "as-is" basis, are intended only to be informative, is not an advice nor a recommendation, nor research, or a record of our trading prices, or an offer of, or solicitation for a transaction in any financial instrument and thus should not be treated as such. The information provided does not involve any specific investment objectives, financial situation and needs of any specific person who may receive it. Please be aware, that past performance is not a reliable indicator of future performance and/or results. Past Performance or Forward-looking scenarios based upon the reasonable beliefs of the third-party provider are not a guarantee of future performance. Actual results may differ materially from those anticipated in forward-looking or past performance statements. IC Markets makes no representation or warranty and assumes no liability as to the accuracy or completeness of the information provided, nor any loss arising from any investment based on a recommendation, forecast or any information supplied by any third-party.

CADJPY - 4hrs ( Sell Trade Target Range 180 PIP )☑️Pair Name : CAD/JPY
Time Frame : 4hrs Chart / Close
Scale Type : Large Scale
------
🛡 spreading knowledge among us and to clarify the most important points of entry, exit and entry with more than 5 reasons
We seek to spread understanding rather than make money
🔗 Key Technical / Direction ( Short )
Type : Mid Term Swing
———————————
Bearish Retest
114.500 Area
Reasons
- Major Turn level
- Pattern Retest
- Day / week low Break
- VisibleRange Hvn
- inner counter Trend
Bullish Reversal
112.800 Area
Reasons
- Major Turn level / W
- Pattern Target
- Choch Zone
- Fixed Range Hvn
- Quarter High Area
- Major Channel Middle Band

short now long laterThis market is amid market correction or correcting the markets imbalances that were previously created. This market will fool most into thinking that it is shorting but I suggest take the sale until the reversal seen here. The chart has revealed a soon to be inverese bullish flag pattern. The market has rejected beautifully off of the nearest QP (quarter point) as well as has remained in an upward trend on the higher timeframes. The market has failed to break or need to break the daily low as well as has continued making higher highs. Take the shorts but be aware of the imbalance candles. There is a 4 hour retest noted that would turn into TP 1 if ignored.

CAD/JPY Short Term SellBased on our weekly analysis yesterday, CADJPY is one of our Sell Pairs. We are trading the CAD/JPY for a short-term sell looking for a target below 113.30. Stop loss above 114.40.

DeGRAM | CADJPY rebound from supportCADJPY has exited the descending channel and is now moving between the trend lines.
The price has reached the support level from where it started the rebound.
Last time the chart also reversed from the current support level
We expect the rebound to continue to the 50% retracement level.
-------------------
Share your opinion in the comments and support the idea with like. Thanks for your support!
