MTN trade ideas


JSE:MTN Short ideaNot a pretty one for MTN shareholders.
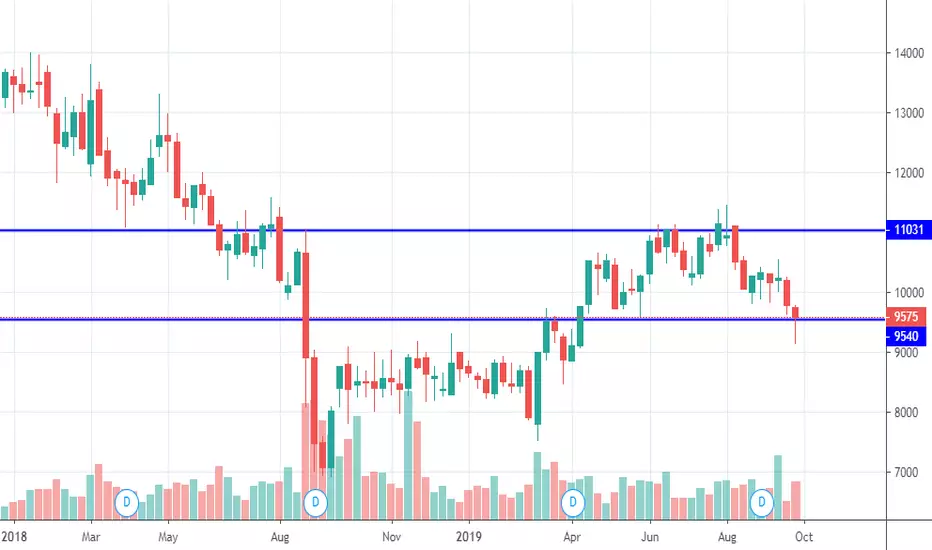
Following the previous impulse to the downside, the price has bounced to 61.8% fib.
A break below could extend to 100% of the previous leg

$JSEMTN WEEKLYMTN has formed a HAMMER candle on support on the WEEKLY. A HAMMER is typically a BULLISH candle when it occurs in a down trend and can signal a trend reversal. If the share price does reverse, the next resistance is around R110.
MTN -Technical UpdateWe may derive the following from the Daily MTN chart:
1. Price was slightly bullish last week, after dropping from our resistance level (purple box).
2. It is probable that price will test the trend resistance line and continue further down to the main support level.
3. Monitor price action and be patient before trading.
4. As always - maintain your risk.
Note: The views provided herein do not constitute financial advice.

MTN Bounce off strong supportJSE:MTN has failed to break through a strong support level and seems to be bouncing for an upward move. The stochastic is also in oversold territory which further signals a possible reversal.


$JSE- MTN Broke below 9800as discussed earlier in the week. a break below 9800 may send price down to 8700


Bullish Engulfing on MTNJSE:MTN is showing a bullish engulfing candlestick pattern due to yesterdays price action. It's looking good for a long position.

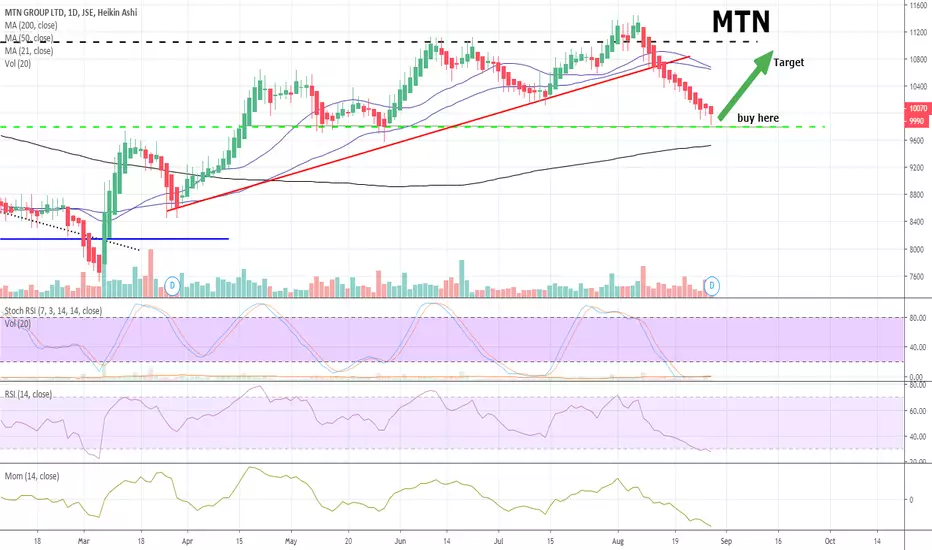
Looking for an AYOBA bounce on MTNEx dividend and holding! MTN is giving subtle hints of strength which could mean that a rally is imminent. MTN is currently holding support (surprisingly) and is also one of the very few stocks STILL trading above it's 200 day moving average. This just has to indicate that the price is still strong relative to the market. Trading now in extreme over-sold territory, this one just has to be worth a punt for an AYOBA bounce. I have got my "SMART strategy" clients long at 100.38 and I'm looking for a target near 110.00. Stop loss is placed at 95.59 and I am risking just 2% of my portfolio. robp@unum.co.za
MTN - Back Down?We may derive the following from the Weekly MTN chart:
1. Price has failed to substantially break/close above the 110 level.
2. The past two weeks have been extremely bearish.
3. It is possible that price may continue down.
4. Monitor price action and watch for further shorting potential.
5. As always - maintain your risk.
Note: The views provided herein do not constitute financial advice.

MTN at 2008 support buy zoneMTN is trading at the support lows of 2008 at a price of R70-R72 , risk reward favours the upside imo.


MTN - Time to fasten your seat-belt The bullish stochastics confirms this break above the R +/- 110 resistance level.
worth picking up a few ... get ready for the ride-> Target at R 120.00

MTN at strong resistanceJSE:MTN is currently at quite a strong resistance level and the expectation is that it will find resistance again. If it bounces off the resistance level, we will look to enter a short once it breaks through the fractal of 26th of July.
If it breaks through the resistance, we could possibly be looking at a potential long position.

MTN shortFalling in the top 5 most sold stocks by foreigners yesterday, MTN is also trading at a resistance zone at or near R110.00. I normally don't like trading these "zones" until I get confirmation but I have jumped in early this time. For this trade, I will use a break-out as my stop loss so a breach of overhead resistance will be my signal to exit the trade. The zone of R101.00/103.00 as support is where I aim to take profit.

JSE:MTN Markup ContinuesFollowing this accumulation range since November 2018 and the markup continues to play out with a series of stepping stone reaccumulation ranges.

Bearish divergence on MTNThe MTN share price has steadily improved since creating a low of R75.05 in February. The recent uptick has seen it touch a short-term high of R111.23. The upward momentum seems to be reducing however, and the stock has struggled to break above the R110.00 horizontal resistance.
This solid resistance could potentially form a turning point for MTN. Especially with the bullish run of the last few months running out of steam.
What interests me more though, is the bearish divergence on the MACD.
Have a look at the chart. MTN reached R106.47 in April and then R111.23 in June. In other words, the stock went higher, yet the MACD went lower. Now MTN is again near the high of June but the MACD is still going lower.
That is a classic bearish divergence and indicates we might see a change in trend from bullish to bearish. On top of that, the Slow Stochastic also shows MTN to be overbought at current levels. This is adding to the bearish sentiment.
Action: Place a Limit order to SELL at R110.00 or better with a Stop Loss set at R122.50. I will aim to take profit at R100.00 and R90.00 respectively.
