MTN trade ideas

MTN - Level to watchLooking at MTN, we may derive the following from the weekly chart:
1. Price is at a previous support level - now resistance.
2. It is important to watch this level and see how price reacts.
3. As always - maintain your risk management.
Let's see what happens.
Note: The views provided herein do not constitute financial advice.


Y'ello...look who's backMTN definitely back on the radar. After a few years of constant bad news, good news lately pushed the share price above its diagonal resistance line, which started in January 2018. Over the shorter term, the 14 day RSI are indicating that $JSEMTN are extremely overbought. Should the share price take a bit of a breather, a close below R92 would put the company back in the same downward trend. A breakthrough these levels could see MTN try and find support at its 200-day (R90.27) and 50-day (R88.95) averages.
It seems while NYSE:JMIA (MTN holds 29.7% of the company) is running 10% plus per day on average, support should remain favorable for MTN as well. The share price is also getting mighty close to a Golden Cross.
On the upside, next target on the company is R110, which places MTN on a forward PE (31 Dec 2020) of 14.5 times and a forward dividend yield of 5.52% (all according to Thomson Reuters).

JSE:MTN | #WeGotU... down to R71.00?OK, maybe I'm getting a bit ahead of myself.
However, let us consider the R108 level where price finds itself.
Price bounced off R108 in early 2016, late 2016 and mid-2017.
A year later, the bulls couldn't hold the level and down she tumbled.
Finally, more than 12 months later, we're back up against R108, now testing it from below.
And we don't know yet whether price will break through or not.
So how to trade this market?
A close below last weeks low would be good enough for me to look for the short...down to R71.00
Alternatively, a push higher and bounce off R108, turning resistance into support sets the bullish case.

$JSE-MTNJSE:MTN
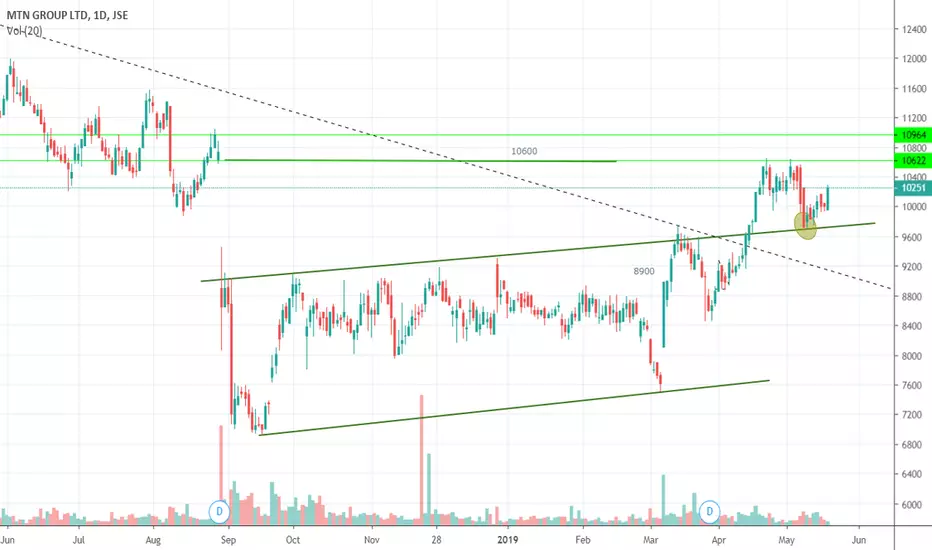
Currently pulling back to back test resistance now support around 10600 area.
Target still around 11800.
Clearly defined up channel made and will probably respect it for days to come.


$JSEMTN - Looking bullish. Could pause short term. MTN has successfully re-tested breakout and has also broken out from a small bull flag.


$JSE-MTNJSE:MTN
Trying to break 10600 level after consolidating in range for few weeks.
Break above 10600 will open target around 11600.

$JSEMTN Bull flag forming. Bull flag forming on MTN. A break could target 11500. Wait for the break.

MTN Symmetrical Triangle BreakoutJSE:MTN has broken out of a symmetrical triangle and is looking good for a short position. Personally, I would wait for a confirmation by it breaking through the fractal on the 13th of May before entering a short position.

MTN Just a gap fillMTN looks strong with a nice W bottom here
I would be a buyer in the green feels like someone is front running here time will tell
For now on shorter TFs this looks good

$JSEMTN has turned technically bullish on the dailyI don't want to use this chart to give targets but merely as an illustration of what a very strong technical chart looks like. Firstly as can be seen by the price action we have seen successive higher lows and higher highs on MTN which is very much a characteristic of bullish chart. Adding to that, we have also seen all the major moving averages cross upward and above the 200 day moving average. This chart has all the characteristics in place for further upside to present itself. I would be a buyer on any dips in the MTN share price. If the stock closes below the previous high/low level of R97.00 that would be my stop loss.

$JSEMTN Channel break, break retest and moving higherAfter a channel break and a retest of this channel, this one could make another run for 10600 and 10950

MTN DAILY TIMEFRAME LONGThis stock recently broke out of a descending trendline,and is currently retesting either the trendline itself or a support zone. I am of the opinion that t his stock will resume going up once enough buyers enter the market. Traders can possibly look to enter a long position at the 9 615 level, which rep [resents a support level.

MTNMTN H4 (240 Minute) Timeframe
Reasons For Entry :
- FTR
- TRIANGLE
Everything Good Yearns Patience And Time
Disclaimer: Trading stocks, commodities, futures and forex has a level of risk and may not be suitable for all investors.


JSE:MTN Selling ClimaxSince the end of August volume has been high on MTN indicating that someone is buying while everyone else is panic selling. Last week was the highest volume since October 2015. Following the Wyckoff logic we expect a Automatic Rally (AR) which will form the upper bounds of a Trading Range (TR). We will then have to watch if this is another redistribution or accumulation.

Ascending Triangle MTNJSE:MTN is on the verge of breaking through an ascending triangle pattern. If it breaks through convincingly, I will enter a long position with the target around the level of the close of the gap from August last year.

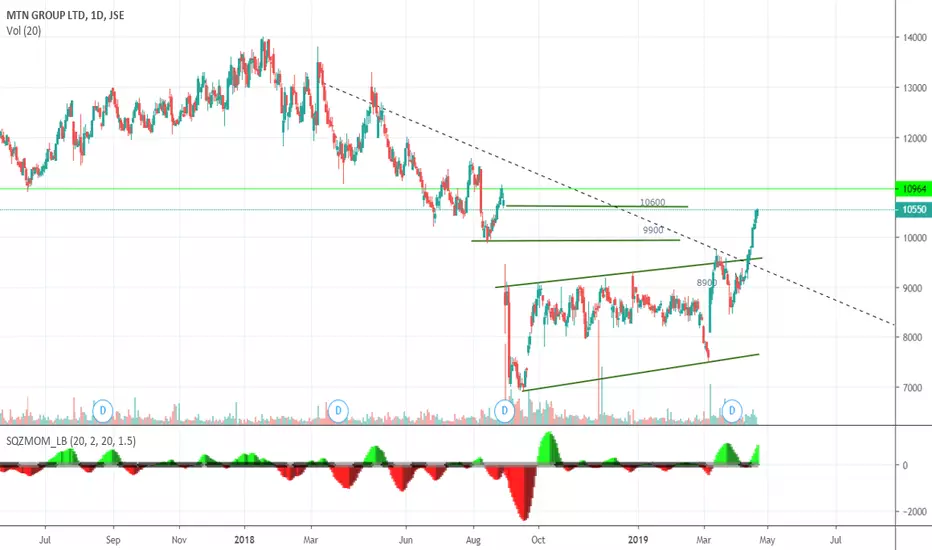
$JSEMTN Target changeInitially had targets of 9900 and 10600, but there is also a gap sitting a little higher at 10965. Maybe worth keeping to see if the upper gap gets filled sometime into the future before taking final profit on this one.