$JSETRU - Truworths: No Double Top; Stock On The Move See link below for previous analysis.
The potential double top outlook has been emphatically invalidated.
Price is tracing out a five wave impulse from 6697 cps and is currently in the third of the third wave.
Buy the dips, momentum looks strong.
Next report date
—
Report period
—
EPS estimate
—
Revenue estimate
—
9ZAR
3.27 BZAR
20.54 BZAR
321.66 M
About TRUWORTHS INT LTD
Sector
Industry
CEO
Michael Samuel Mark
Website
Headquarters
Cape Town
Employees (FY)
12.13 K
Founded
1917
ISIN
ZAE000028296
FIGI
BBG000C2FYC7
Truworths International Ltd. is an investment holding company, which engages in the retailing of fashion apparel and accessories. It operates through the Truworths and Office segments. The Truworth segment offers clothing, footwear, and related products on behalf of South African designers. The Office segment retails footwear in the United Kingdom, Germany, and Republic of Ireland. The company was founded in 1917 and is headquartered in Cape Town, South Africa.

$JSETRU - Truworths: Potential Double Top AlertSee link below for previous analysis.
Truworths has met resistance in the 8441 to 8529cps zone.
Though premature to call this a Double Top, how price action reacts around the 6697cps neckline will hold the key for the short-term outlook.
I am neutral for now.

Our opinion on the current state of TRUTruworths, operating under the ticker TRU, is a notable retailer in the clothing, footwear, and accessories sector with a strong presence in Southern Africa and the UK, boasting listings on both the JSE and the Namibian Stock Exchange. A significant portion of its sales, approximately 70%, comes fro

Our opinion on the current state of TRUTruworths (TRU) is a clothing, footwear and accessories retailer that operates in Southern Africa and the UK and is listed on the JSE and the Namibian Stock Exchange. It makes 70% of its sales in South Africa on credit - so its credit management strategies are critical. It is in a highly competitive

$JSETRU - Truworths: Will The Bull Trend Resume?See link below for previous analysis.
Truworths had a great run from the 4682 low to peak at 8441.
Recent price action is showing toppish signs.
Though it's still premature to call for a head & shoulders pattern, I am seeing potential signs of one therefore I will be monitoring price action with t

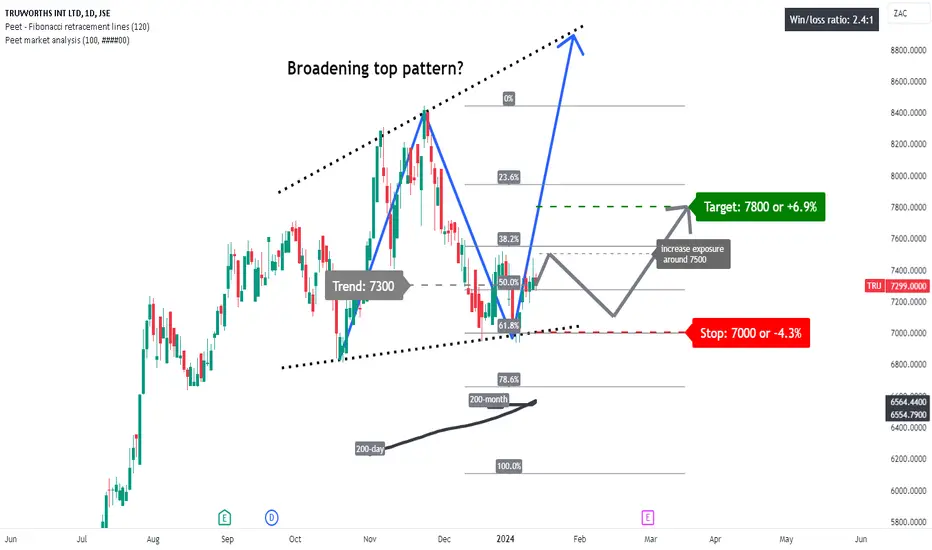
TRU: broadening top pattern developing?A price action above 7300 supports a bullish trend direction.
Increase long exposure for a break above 7500.
The target price is set at 7800 (just below its 23.6% Fibonacci retracement level).
The stop-loss is set at 7000 (its 61.8% Fibonacci retracement level).
A potential broadening top pattern ap
TRUWORTHS INT (TRU)TRUWORTHS - The current price is now testing the lower trend line within a broadening wedge pattern. Anticipating potential support at the trend line; however, a break below it might signal a significant decline, offering a potential short play.
It's worth noting that in the 50 days leading up t

Update on Truworths Short Idea: Target ReachedI didn't have the time to update you on my TRU short/sell idea however I am doing it now.
The share reached the full target of 7420c (from an entry of 8189c). This represented a 9.3% ungeared gain.
The original idea was published here on 06 November and is attached to this post.
For more resear

TruworthsTruworths #WeeklyChart points to 100.
It's overbought on lower timeframes though, meaning a pullback is possible in the short term.
A retest of the 70-76 area can be used to establish a 'long' position with a profit target of 100.
#WeeklyChart

TRU Sell at current levels or higher. Can it trade slightly higher? Yes. Can it build a short term consolidation top for a few more sessions? Yes. The following factors, however, may favor traders looking to enter a short/sell trade (1) The share has appreciated by 19.8% off it's recent lows (19 October

See all ideas
An aggregate view of professional's ratings.
Frequently Asked Questions
The current price of TRU is 8,913 ZAC — it has increased by 0.77% in the past 24 hours. Watch TRUWORTHS INT LTD stock price performance more closely on the chart.
Depending on the exchange, the stock ticker may vary. For instance, on JSE exchange TRUWORTHS INT LTD stocks are traded under the ticker TRU.
TRU stock has risen by 0.83% compared to the previous week, the month change is a 1.30% fall, over the last year TRUWORTHS INT LTD has showed a 34.76% increase.
We've gathered analysts' opinions on TRUWORTHS INT LTD future price: according to them, TRU price has a max estimate of 10,200.00 ZAC and a min estimate of 8,700.00 ZAC. Watch TRU chart and read a more detailed TRUWORTHS INT LTD stock forecast: see what analysts think of TRUWORTHS INT LTD and suggest that you do with its stocks.
TRU stock is 2.09% volatile and has beta coefficient of 1.47. Track TRUWORTHS INT LTD stock price on the chart and check out the list of the most volatile stocks — is TRUWORTHS INT LTD there?
Today TRUWORTHS INT LTD has the market capitalization of 32.85 B, it has decreased by 0.53% over the last week.
Yes, you can track TRUWORTHS INT LTD financials in yearly and quarterly reports right on TradingView.
TRUWORTHS INT LTD is going to release the next earnings report on Aug 15, 2024. Keep track of upcoming events with our Earnings Calendar.
TRU earnings for the last half-year are 5.05 ZAC per share, whereas the estimation was 5.06 ZAC, resulting in a −0.20% surprise. The estimated earnings for the next half-year are 3.40 ZAC per share. See more details about TRUWORTHS INT LTD earnings.
TRU net income for the last half-year is 1.97 B ZAR, while the previous report showed 1.40 B ZAR of net income which accounts for 40.67% change. Track more TRUWORTHS INT LTD financial stats to get the full picture.
TRUWORTHS INT LTD dividend yield was 9.98% in 2023, and payout ratio reached 63.59%. The year before the numbers were 10.34% and 63.59% correspondingly. See high-dividend stocks and find more opportunities for your portfolio.
As of Jul 27, 2024, the company has 12.13 K employees. See our rating of the largest employees — is TRUWORTHS INT LTD on this list?
EBITDA measures a company's operating performance, its growth signifies an improvement in the efficiency of a company. TRUWORTHS INT LTD EBITDA is 4.79 B ZAR, and current EBITDA margin is 23.20%. See more stats in TRUWORTHS INT LTD financial statements.
Like other stocks, TRU shares are traded on stock exchanges, e.g. Nasdaq, Nyse, Euronext, and the easiest way to buy them is through an online stock broker. To do this, you need to open an account and follow a broker's procedures, then start trading. You can trade TRUWORTHS INT LTD stock right from TradingView charts — choose your broker and connect to your account.
Investing in stocks requires a comprehensive research: you should carefully study all the available data, e.g. company's financials, related news, and its technical analysis. So TRUWORTHS INT LTD technincal analysis shows the neutral today, and its 1 week rating is buy. Since market conditions are prone to changes, it's worth looking a bit further into the future — according to the 1 month rating TRUWORTHS INT LTD stock shows the buy signal. See more of TRUWORTHS INT LTD technicals for a more comprehensive analysis.
If you're still not sure, try looking for inspiration in our curated watchlists.
If you're still not sure, try looking for inspiration in our curated watchlists.