LEVERUSD 1W$LEVER ~ 1W
#LEVER Make purchases gradually after breaking through this resistance line, with a minimum target of 20%+
LEVERUSDT trade ideas

LEVER, getting ready to revisit X2 price!LEVER recently went parabolic on the 1st week of October by peaking at 0.30 range. From thereon, as per the usual parabolic case which warrants a hefty correction, the coin dip dives into 0.12 territory.
At present, LEVER is slowly building a good solid base and slowly crawling up based on recent daily metrics. Seven days of straight net buying activity has been registered conveying the current price range as the new base for the next series of ascend.
The coin is bouncing off a very strong major order block support with precision.
Expect some weighty price movement from here on favoring the bulls.
We are now at a good discounted range. It's not always you get a good setup like this one. SEED.
Spotted at 0.001400
TAYOR.
Safeguard funds always.

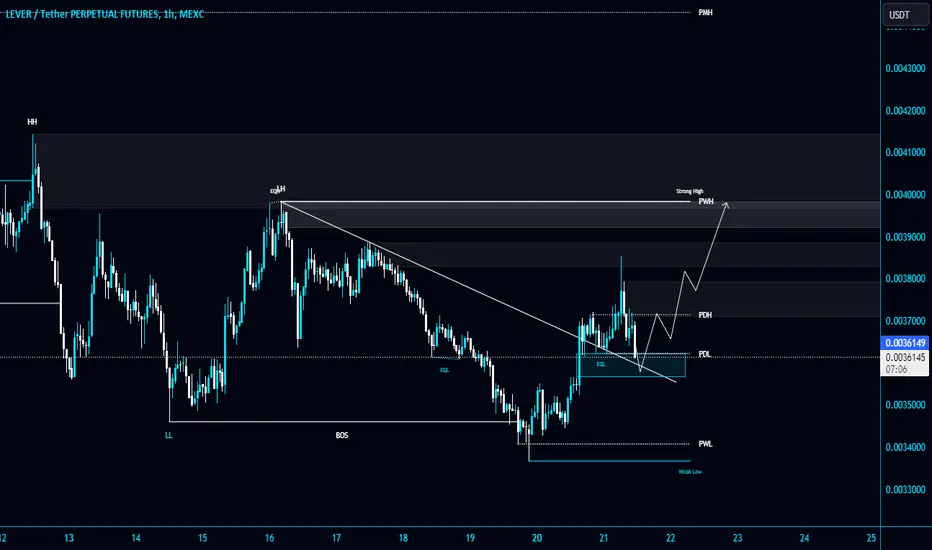
#LEVER/USDT breaks the diagonal trendline and heading towards a #LEVER/USDT breaks the diagonal trendline and heading towards a retest in 1-Hour TF!
Wait for a successful retest to long $LEVER. The local resistance level is PWH $0.00398.
Is the LEVER super bullish?First of all, you should know that this symbol is low volume and almost risky.
We expect a medium-term bullish trend to start from the green range.
We have a triangle of the type of completion of the bearish trend on the chart
If the green range is maintained, LEVER can have significant movements.
The targets are marked on the chart.
Closing a daily candle below the invalidation level will violate the analysis
For risk management, please don't forget stop loss and capital management
When we reach the first target, save some profit and then change the stop to entry
Comment if you have any questions
Thank You

#LEVER,massive buying opportunity.Welcome, Trader. Welcome to our cryptocurrency community! 🚀We are delighted to welcome you, whether you are an experienced trader or new to the world of cryptocurrency.
We are willing to discuss #LEVER.
#LEVERUSDT 🔥🚀.
Update: 💹.
#LEVERUSDT creates a symmetrical triangular pattern over a 6-hour period.
We are waiting for a valid breakout confirmation ✅.
Once it breaks above and the daily closing price is above the resistance line. We will witness a bull rally 💹🚀.
We anticipate a nearly 40% increase in the near future.


LEVER ANALYSIS🔮 #LEVER Analysis
🌟 There is a formation of "ADOM and EVE Pattern" in #LEVER and its a bullish pattern. We are waiting for a perfect breakout. If #LEVER breakout with good volume then we will see a very good bullish move.🚀🚀
🔖 Current Price: $0.003835
⏳️ Target Price: $0.005381
⁉️ What to do?
- We have marked some crucial levels in the chart. We can trade according to the chart and make some profits in #LEVER. 🚀💸
#LEVER #Cryptocurrency #DYOR

Lever x10+ Is it possible to predict a big move in price?
I think it is. You just need to wait for a confirmation breakout candle with upper volume.
I think this chart is ready for a great rally in the next few months. Just wait until you see a breakout candle ...

LEVERUSDT.4HExamining the 4-hour chart of LEVER/USDT, I can discern a few essential technical aspects to aid in developing a trading approach.
### Key Resistance and Support Levels:
- *Resistance 1 (R1):* $0.004420 - This level has acted as a ceiling for the price action, marking a significant point where sellers previously came in strongly.
- *Support 1 (S1):* $0.002840 - This is a critical support level that has been tested and held, indicating buyers' interest at this price.
- *Support 2 (S2):* $0.001934 - This is the next substantial support level below S1, which could act as a fallback should the price break below S1.
### Technical Indicators:
- *Relative Strength Index (RSI):* The RSI is at 47.28, which places it near the middle of the range, indicating neither overbought nor oversold conditions. This neutral stance can suggest a potential for movement in either direction without strong bias.
- *Moving Average Convergence Divergence (MACD):* The MACD line is slightly below the signal line, and both are near zero on the histogram. This configuration hints at a bearish bias but lacks strong momentum, suggesting that the market is in a phase of uncertainty or consolidation.
### Trend Analysis:
- The chart displays a somewhat choppy price action with no clear sustained direction over the recent past. The recent break below a minor support indicates potential for further downside unless buyers step in decisively.
### Candlestick Patterns:
- Recent candlesticks show a mix of bullish and bearish closes, with no dominant pattern emerging. This indecision in candlestick patterns aligns with the RSI and MACD readings, suggesting a market without a strong directional bias.
### Conclusion:
The LEVER/USDT market is currently showing signs of indecision with a slight bearish undertone as indicated by the recent price action and the position of the MACD below the signal line. Given the RSI's neutral position, there is a potential for price movement in either direction, so traders should monitor these levels closely for breakout or breakdown signals.
For a trading strategy, consider a cautious approach: entering a buy if there's a clear reversal pattern near S1 with a tight stop loss below S2, aiming for R1 as an initial target. Conversely, a break below S1 could warrant a short position, targeting S2, with a stop loss just above S1. As always, it’s prudent to monitor the market response at these key levels and adjust positions accordingly to manage risk effectively.

LEVERUSDT(LeverFi) Daily tf Range Updated till 05-05-24LEVERUSDT(LeverFi) Daily timeframe range. at this decent volume market its holding well. its trying to reclaim above 0.003927 which can pretty much open its way till 0.004984. and above that is price discovery which brings a lot of opportunity.

Lever scalping It appears that a major zone is being rejected, so I have taken a short position in order to quickly profit.

Lever is very bearish I anticipate a sharp wick down from this level as it breaks all the support that the price respect before

$LEVER still inside an accumulation range🧐 I do expect this co$LEVER still inside an accumulation range🧐
I do expect this coin to play against the whole market🚀

LEVER CAN YOUR FUND DOUBLEif you buy leverusdt very important take low leverage or spot trade it.
lever can grow about 0.0046.
based on fibonacci leves

LEVERUSDTHello, My Friends.
I have a trade signal for BINANCE:LEVERUSDT which you might find useful.
------------------------------------------------------------------------------------------
If you want to stay ahead in the crypto race, it's important to trade smart and stay informed. Keep in mind that knowledge is power in the dynamic crypto market.
So, don't miss out on real-time updates and expert analysis. Hit the follow button and let's achieve success together in the crypto journey!
However, please note that this is for informational purposes only. Trading involves risk and should be done with caution. Always make sure to do your own research before making any trading or investment decisions.
Happy trading!

Lever 🚀 The price appears to be bullish on all time frames. I anticipate it will break through all resistance levels from this point.

Lever TradeI have observed bearish signals on Lever, as there is a clear rejection from a resistance level. Currently, I am in a short position. Once my take profit (TP) is reached, I will switch to a long position.

LEVERUSD 1WLEVER ~ 1W
#LEVER This is the Buy zone Since this Chart was created. It is very interesting to re-accumulate in this zone, with a long-term target of at least 20%+. Make purchases gradually.

#LEVER/USDT Breaks & retest the Diagonal Trendline in 4-Hour TF!#LEVER/USDT Breaks & retest the Diagonal Trendline in 4-Hour TF!
$LEVER is looking good for a short scalp position. The PWL $$0.002055 and PML $0.001874 are the major support zone.

LEVER ANALAYSISThe price breaks through resistance and maintains support on higher time frames. I anticipate a significant increase in price for leverage.

LEVERUSD 1WLEVER ~ 1W 📈
#LEVER Looks like the accumulation has been completed. Make purchases gradually from here, with a minimum target of 20%++

LEVER SHORTIam in short postions because it needs to correct because in the rsi & price it is showing Divergence

LEVER - BUY SETUP (FEB 2024)LEVER - BUY SETUP (FEB 2024)
This token is in a prime buy zone, indicating the potential for an upward trend.
