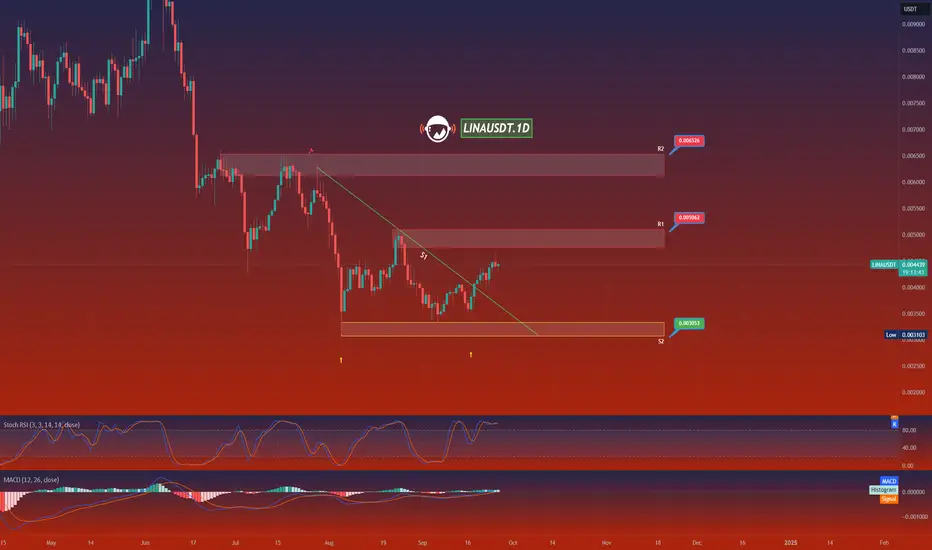
LINAUSDT.1DIn the technical analysis chart provided for LINA/USDT on TradingView, we observe a detailed representation of Linear's price movement against the US Dollar Tether on a daily timeframe. The chart identifies two key resistance levels (R1 at $0.005062 and R2 at $0.005626) and two support levels (S1 at
LINA Analysis (4H)It looks like a bullish pattern has formed from where we placed the green arrow on the chart.
So far, by the data available from this pattern, it appears to be a triangle.
Wave D is over and price is forming wave E.
It is expected to move towards the red range while maintaining the green range.

LINA 4H Chart UpdateLINA seems to be correcting the impulsive downside movement that began in late August.
In my primary count, we're in the beginning of blue wave C. The 61.8% level (at 0.004404), which matches a resistance zone (in green) and is close to the 100% extensions is a good target.

LINA - LINEAR - this is sleeping giantThis is a sleeping giant. It is possible that it has found its bottom for 2024-2025 bull cycle. Look at this chart and let me know what you think.

bottom must be confirmed at $0.003-$0.004It has been in consolidating zone for more than 2 years. And product development team is also doing a great work. But If it respects this bottom around $0.003-$0.004, this also suggests there is a high chance it can make a strong reversal from $0.003 area to $3-5$ range in an upcoming bull run

#LINA/USDT trying to break the Diagonal Trendline in 1-Hour TF!#LINA/USDT trying to break the Diagonal Trendline in 1-Hour TF!
Wait for BO to open a long position. The local resistance level is PDH $0.00406 and the support level is PWL $000363. The PWL is already swept.

potential reversalIf it respects this bottom, there is very high chance that it will reach to top 20 coins. It's only matter of time.

Reversal?Can it really pull it off and can do 10x return? if weekly chart is the bottom, we can expect $0.10-$0.50 range in the bull run, if it’s not the bottom, DYOR.

#LINA/USDT is heading towards the Diagonal Trendline in 1-Hour T#LINA/USDT is heading towards the Diagonal Trendline in 1-Hour TF!
Wait for BO to open a long position. The local resistance level is PDH $0.00406 and the support level is PDL $000384.

LINA looks bearishFrom where we put the red arrow on the chart, it looks like LINA is forming an ABC now that wave B is over and we are in the middle of wave C.
We are looking for sell/short positions in the supply range.
Closing a daily candle above the invalidation level will violate the analysis
For risk manage

See all ideas
Displays a symbol's price movements over previous years to identify recurring trends.