LITUSDT trade ideas

Daily Ron Jeremy- Inside the RELOAD ZONE of the last move:
- MOMENTUM DIVERGENCE with W structure confirmed
- W structure


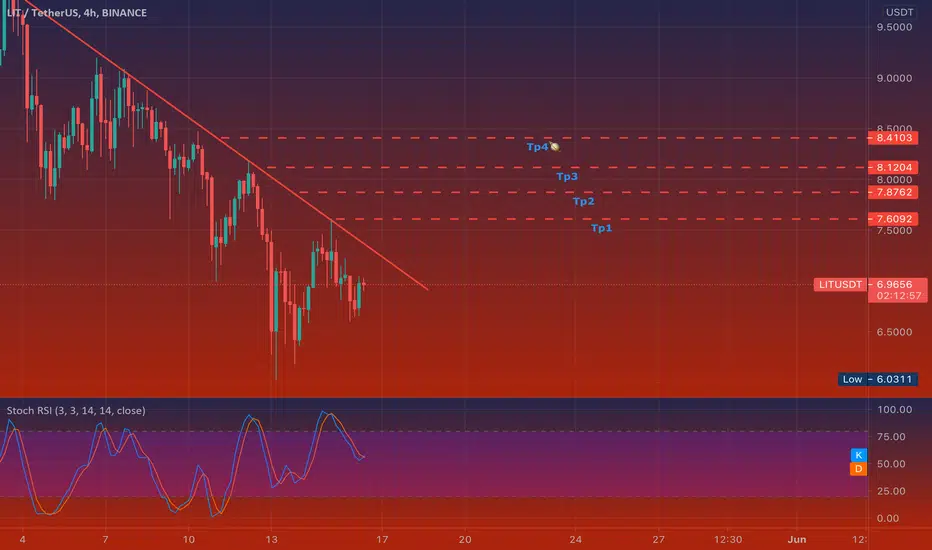
LIT LongTP 1 @ 4.58
TP 2 @ 4.72
TP 3 @ 5.48
TP 4 @ 6.22
Always do your research before entering a trade

LITUSDT wants to retest 6$LITUSDT wants to retest 6$ on 0.5 Fibonacci level. IF and only IF the price will have a breakout from daily and 4h resistance, According to Plancton's strategy (check our Academy), we can set a nice order
–––––
Follow the Shrimp 🦐
Keep in mind.
🟣 Purple structure -> Monthly structure.
🔴 Red structure -> Weekly structure.
🔵 Blue structure -> Daily structure.
🟡 Yellow structure -> 4h structure.
⚫️ Black structure -> <4h structure.
Here is the Plancton0618 technical analysis, please comment below if you have any question.
The ENTRY in the market will be taken only if the condition of the Plancton0618 strategy will trigger.


LIT/USDT Recovery signs with 2.5x potentialLitentry as identity provider has to have a bright future within the crypto space where some transaction have to be verified with KYC.
Currently we look for a breakout of the downwards channel.
Once we pull this off we expect a nice recovery.
News:
LIT was added to Binance flexbible savings.
Partnership with Imeplatform and Decredit
Basic rules:
- Never buy the top/ATH
- Take profit as long as you can (also partial profit is profit)
- Use Stop/loss for leveraged positions
- If you are not experienced, don't leverage in the first place
Enjoy the ride and don't be too greedy.
If you like the content, please like, comment and give this channel a follow.
We would love it if you could share your thoughts in the comments.
Discussions are very welcome here.
Always do your own research and keep in mind that my charts and comments cannot be considered financial advice.
Cheers
ps.
Chart explanation:
Main lines:
- Green lines are tested support lines.
- Orange lines are resistance lines or, if we are above, possible support lines which were not tested yet.
- Cyan line is for volume trendline.
- White lines are Fibonacci retracement levels
Helplines:
- Purple lines are trendlines we take a look at.
- Yellow lines are for visual help only.
Boxes:
- Either entry zone or support zone. Check the description.

LITUSDT Ready for $10Pattern Formation:- Double Bottom + W Pattern
RSI Crossing 40 From Lower level + MACD Positive Crossover.
Volumes Increasing adding confirmation.
Entry Point -
65% @ $4,
20% @ $3.50,
15% @ $3
Targets $5.16-$6.35-$10.00.
Short Term To Medium Term


LITUSDTSome of the levels i am watching for given that we are oversold on most of the coins and we should expect some bounces here.


LIT/USDTEverything is on the graphic.
Trade Safely
This is not financial advice! Just my idea about LIT!
Do your own research.
If do you see a mistake or want to help, you can write in the comments.
Take your own risk.
Not investment advice.
My ideas are only helpful and not advice to buy or sell, you are the decision-maker.

LITUSDT is testing the weekly support 🦐LITUSDT is testing the weekly support. IF the price will have a breakout from the resistance, According to Plancton's strategy (check our Academy), we can set a nice order
–––––
Follow the Shrimp 🦐
Keep in mind.
🟣 Purple structure -> Monthly structure.
🔴 Red structure -> Weekly structure.
🔵 Blue structure -> Daily structure.
🟡 Yellow structure -> 4h structure.
⚫️ Black structure -> <4h structure.
Here is the Plancton0618 technical analysis, please comment below if you have any question.
The ENTRY in the market will be taken only if the condition of the Plancton0618 strategy will trigger.

LITUSDT Falling Wedge PatternLIT USDT is showing a falling wedge pattern. I am expecting a bulky breakout. It is not a financial advice.


LITUSDTHello to you all. Mars Signals team wishes you high profits at all times.
We are in a 4-hour time frame. The price has reduced its strength and is starting to move downwards, and each time it has failed to defeat its resistance line, it is doomed to fall. For the above goals, if they have this currency, they will make a profit if they reach the top line of the save, and if the line breaks upwards and stabilizes, they will enter the trade for the above goals.
Warning: This is just a suggestion to you and we do not guarantee profits.
Wish you luck!

LIT is going to doubleLike to support and follow for more content!
LIT is giving us a great trading opportunity, if we break above the 10 major psychological resistance level which is in confluence with the 50% of the Fibonacci, we will see a continuation to our targets:
12 (major resistance and 61.8% of the Fib)
15 (72.6% of the fib)
18
Support: 7.7
Resistance: 9.5-10
What do you think?
Good luck traders,
NajjarTrading

[LITUSDT] Patience will be paying! End of falling wedge.Hi all!
LIT has been struggling for a good month now since that huge flashcrash 18th of April on all altcoins.
As you can see nevertheless, it stayed in that long accumulation area since its listing on Binance.
Even though volume is still low, I'm still strongly bullish on it for the next few weeks.
You can also notice a strong falling wedge on daily timeframe within this ranging zone.
Fundamentals are really great and LIT is really a one of a kind project in its niche.
With Polkadot's main event around the corner, we can even expect some potential massive news that would fit perfectly with this current bullish chart. A slot on Polkadot's auction would be a great news!
RSI is still very low and MACD's histogram shows a light reversal.
As we are trading under all EMAs on daily TF, we can expect to trade above them if we manage to successfully break this falling wedge by the top.
Dotted line represents a potential resistance we will have to break.
We'll definetely reach the top of that accumulation zone soon (around $13) and then hopefully go for another ATH.
All indicators clearly show we are currently accumulating. And guess why people try to get more of something..? ;-)
This is not an investment advice, always do your own research.
Good luck everyone!

🆓Litentry (LIT) May-15 #LIT $LITThe buying force at 6$ zone showed us the dip of this period is 6$, so we will start accumulating LIT in the range of 6-7$ for target at 9$ and 12$ zone
📈BUY
-Buy: 6.8-7.2$. SL if B
-Buy: 5.85-6.15$. SL if B
📉SELL
-Sell: 8.8-9.2$. SL if A
-Sell: 11.7-12.3$. SL if A
❓Details
🕯Timeframe : 1 Day
📈Red Arrow : Main Direction as BUY & SELL section
📉Blue Arrow : Back-Up Direction as BACK-UP section
🟩Green zone : Support zone as BUY section
🟥Red zone : Resistance zone as SELL section
🅰️A : The Close price of candlestick is Above the zone
🅱️B : The Close price of candlestick is Below the zone
