Exel This is the moment right here. My level I’ve been waiting for. Time
To long ?! This will be the third touch at same area we tapped and ran both times last time. Will history repeats ? I will take this chance stops below or cut upon closing candle below support. Good luck
0IJO trade ideas

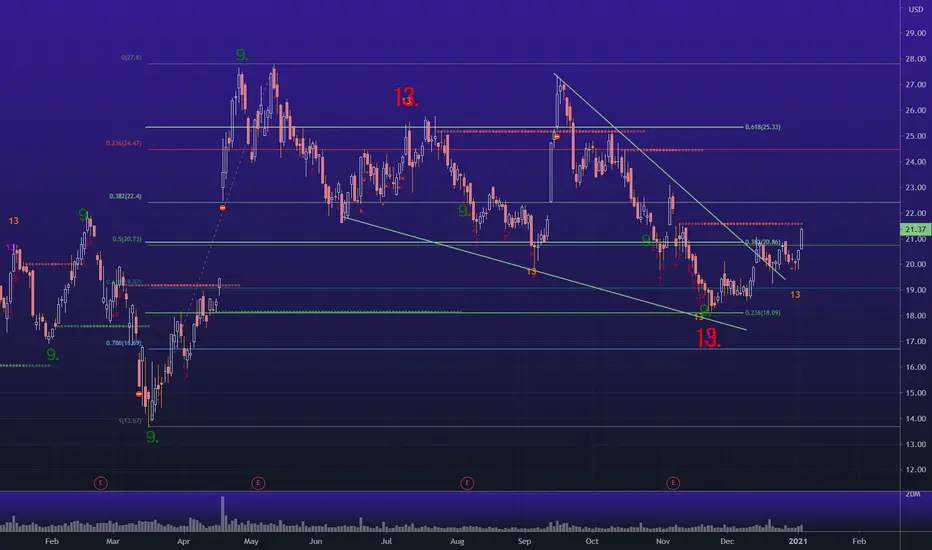
Exel Patience here as we could retest lower support for the 3rd tap. Last 2 tests caused a sick rally. Will the 3rd tap do the same? Or will this support break as we now put in a lower high? I’d be watching 17$ if we hold and bounce, targeting half off at the downtrendinf resistance of the last 2 highs. This next push may reject aroubd 21$ But blasting through could give a dope risk to reward leading to 25/26$. 17$ will be one I am watching heavily

EXCEL - LongsProbably wont be in this until monday as want to see how markets will open.
XBI looking like a leading sector
EXCEL multiple daily closes above EMA cloud + Retest and push higher of 200EMA
HOWEVER - Missing volume on todays move higher.
2 TP marked on chart
Tight stop as always

EXEL LONGSAS PER THE CHART
3 suggested TP indicated
Very strong company - Positive EPS revisions
Biotech looking like it could be the next leading sector

bullish flag? Entry: $23.00
SL: $21.80 (loss 5.4 %) (visual only, close if daily closing price below)
TP: $29 (profit 27 %, ratio 5)
Hello Trader,
Exelixis is building a bullish flag right now. After the upper trend line is broken, a buy signal is created. I like the risk-reward ratio.
Deutsch
Hallo Trader,
Exelixis buildet gerade eine bullische Flagge aus. Nachdem die obere Trendlinie durchbrochen wird, entsteht ein Kaufsignal. Das Chancen Risiko Verhältnis gefällt mir gut.

exelconsolidation on previous resiatnce this is gearing up for a huge pop. might need more time to consildate but man its getting ready! all eyes on this pharma


EXEL - 5.96% Potential Profit - Ascending TriangleI'm cautious with this trade. I don't usually get into positions with a risk/reward smaller than 3.
- Target Entry: $25.65
- Target Stop Loss: $25.05
- Target Exit: $27.19
- Risk / Reward Ratio: 2.57
About me
- Note that I tend to adjust stop losses in order to secure profits early and preserve capital. This means that the target price is going to be achieved as long as there are no strong pullbacks that trigger my new adjusted stop loss


Long | EXELNASDAQ:EXEL
Possible Scenario: LONG
Evidence: Price Action
TP1 ~ 24.70
This is my idea and could be wrong 100%.

Exelixis is a great opportunityHi guys, hope you are all well. Today we are looking at Exelixis, an oncology-focused biotechnology company that focuses on the discovery, development, and commercialization of new medicines to treat cancers in the United States. The market cap of the firm is roughly $7 billion. What drew me to looking into this company was its cash and cash equivalents value, a whopping $1.2 billion, giving it an almost 20% cash to market cap valuation. The company is forecasted to grow by 40% this year and has absolutely no debt. The P/E is high at a level of 63 however I am not concerned at all by this figure due to the fact that EPS is forecasted to grow by ten fold in the next 3-5 years. From my wave analysis, we can see that the stock consolidated nicely to form its wave 2 and is now in the approach of starting its Wave 3. This is in 1 week time scales, so I do not expect this to be a short term trade. Nevertheless, this really is a fantastic opportunity to possibly triple your investment in the next 2-3 years and I am already positioned in the stock. This is not investment advice, so please do your own due diligence before making any decisions. I hope this is helpful

$EXEL - Upwards Momentum and potential breakout1st published idea for my new process which begins with the stock screener. I am trying to identify stocks that have bottomed out or at least hit a lower resistance that begin to have upwards momentum in the RSI coupled with an EMA crossover event.
Initial Filters:
>2B Market Cap to filter small companies
Debt to Equity Ratio (MRQ) < 0.5 to mitigate some risk
Average Volume (30 day) > 500k -> We need volume for a big breakout
Exchange limited to NYSE and NASDAQ
RSI (56 hrs) > 45 -> In order to have a breakout there needs to be upwards momentum in the RSI
RSI (28 hrs) between 54 and 70 -> shorter term RSI than the other to show upwards momentum.
At any given time this returns around 75 tickers.
Next setup alerts on EMA(40hrs) over EMA(120hrs) and EMA(80hrs) over EMA(200hrs). This will result in only a few alerts per day. As they come out check to see if they fit your standard trend analysis for a potential breakout.
$EXEL fits the bill perfectly. I am active with a target around $26-$27 short term.

Long ideaExelixis, Inc., an oncology-focused biotechnology company, focuses on the discovery, development, and commercialization of new medicines to treat cancers in the United States. The company’s products include CABOMETYX tablets for the treatment of patients with advanced renal cell carcinoma who received prior anti-angiogenic therapy; and COMETRIQ capsules for the treatment of patients with progressive and metastatic medullary thyroid cancer. Its CABOMETYX and COMETRIQ are derived from cabozantinib, an inhibitor of multiple tyrosine kinases, including MET, AXL, RET, and VEGF receptors. The company also offers COTELLIC, an inhibitor of MEK as a combination regimen to treat advanced melanoma; and MINNEBRO, an oral non-steroidal selective blocker of the mineralocorticoid receptor for the treatment of hypertension in Japan. In addition, Exelixis, Inc. is developing XL092, an oral tyrosine kinase inhibitor that targets VEGF receptors, MET, and other kinases implicated in growth and spread of cancer. It has collaboration and license agreement with Ipsen Pharma SAS, Takeda Pharmaceutical Company Ltd., Roche, Aurigene Discovery Technologies Limited, Iconic Therapeutics, Inc., Invenra, Inc., StemSynergy Therapeutics, Inc., Genentech, Inc., GlaxoSmithKline, Bristol-Myers Squibb Company, Merck, Daiichi Sankyo Company, Limited, and clinical collaboration with Ipsen. The company was formerly known as Exelixis Pharmaceuticals, Inc. and changed its name to Exelixis, Inc. in February 2000. Exelixis, Inc. was founded in 1994 and is headquartered in Alameda, California.
Market Cap
$
5.7B
Dividend Yield
Beta vs SPX
0.9
Short Interest
4.6%
Volatility (1Y)
45.4
Hedge Fund Held
Industry
Biotechnology
Competitors
ABBV
AMGN
GILD
VRTX
Performance
14.46
Low
18.39
1-Year Price Range
27.42
High
1M
3M
YTD
1Y
EXEL
-15.8%
-17.3%
4.4%
13.0%
EXEL vs SPX
-19.5%
-23.1%
-8.3%
-4.2%
Valuation
Forward P/E (NTM)
109.9X
Trailing P/E (LTM)
38.4X
Price/Book
3.1X
EV/Sales (LTM)
4.8X
EV/EBITDA (LTM)
25.4X
Capital Structure
Market Cap
$
5.7B
Total Debt
$
48.3M
Cash
$
1.2B
Other
Enterprise Value
$
4.6B
Earnings Estimates
Fiscal Year
EPS
YoY
Sales
YoY
2020
0.46
-54.6%
$
930.7M
-3.8%
2021
0.82
77.4%
$
1.2B
24.5%
2022
1.48
80.5%
$
1.5B
33.4%

$EXEL Exelixis Inc Potential Channel breakout
The company pre announced improved earnings and guidance over the weekend.
stock was in a channel ( bull-flag)
potential entry above POC @ $25
target $27.25

Long | EXELNASDAQ:EXEL
Possible Scenario: LONG
Evidence: Price Action
This is my idea and could be wrong100%

EXEL BreakoutI feel like this could turn into another false down-break, but it is getting close to a breakout.
There is a good amount of volume that has been leveling out nicely, and I would expect a breakout later in the week, but this might another opportunity. However, buyers have had a little more control over this, and it's already broken through 1 of the major supports.

Educational material nr.8In this article I will tell you about another metrics, which can be usefull at analysis of the company. Based on GuruFocus metrics.
Another metrics from Financial Strenghs metrics:
Piotrowski F-score — used for understanding of the financial strengh of the company. Scores from 0 to 9. 1 score means, that company have one of the characteristics (positive net income, positive ROA, positive Operating Cash Flow, CFO is bigger then net income and other). 9 is the higher rank and means, that company is strong.
Altman Z-score — measure of results of testing company on bankruptsy risk. Higher — means that company is safe.
Beneish M-score — Metric of earning manipulation of the company. If it has negative score — that means, that company does not manipulate of the earnings. It can be analysed with comparison of PE and PE without NRI and PE with Cash Flow.
WACC vs. ROIC — Weighted Average Cost of Capital vs Return On Invested Capital. If ROIC > WACC, that means that investing in this company is effective and profitable, because capital generate profit, which is bigger then cost of capital.
Metrics from Profitability Rank
3-Year Revenue Growth Rate — average revenue growth rate per 3 years. Usual auxilar metric.
3-Year EBITDA Growth Rate — same average meaning of EBITDA per 3 years.
3-Year EPS without NRI Growth Rate - EPS without NRI per 3 years.
This 3-years average metrics are not so important then metrics per 5-10 years, because they have big influence of not-so-far-news/acts of firm.
From Dividend and buyback metrics:
Dividend Yield % - financial ratio, show relation dividends to stock price. Higher — means good, but it depends from company’s situation. For example 0 means, that firm does not pay dividends, but makes re-investments, what have positive influence on company.
Dividend payout ratio — dividends, which payed related to the company net income.
Forward Dividend Yield % - Usually don’t used, from reason of future non-guaranted company work. But it can be usefull for understanding expectation of the market.
5-Year Dividend-on-Cost % - Rarely used, but can be useful in some situations. Dividend divided by price of purchasing of the stock.
They are used from situation in analysing of the company. Because they can add some points to see full situation if main metrics and indicators with financial statement analythis can’t give review of the firm.

EXELIXIS is in BUY Situation DailyHey people, EXELIXIS is in a bullish continuation with a large buying volume. And on the TIMEFRAME 1 Min a refusal of the sellers accompanied by a bearish volume. It goes to its next low point then starts rising again, Great potential to come to the highest before.
Please LIKE & FOLLOW, thank you!


Exelixis possible breakoutIt seems like the stock Exelixis has lower highs and higher lows, makes a perfect pennant. It is highly possible that Exelixis will break out above the upper line of the triangle and so it will have the potential to go to 27.81


EXEL Long term . IBB and XBI broke out.
Will EXEL follow the sector trend with an excellent clinical read outs across multiple oncology fields?
