0KB7 trade ideas


OKTA - January 3, 2020OKTA provides identity management services for business through integrating local servers with the Okta Identity Cloud. This platform enables enterprise clients to have users sign onto a variety of applications using a single secure identity login across all platforms. OKTA has a high lifetime value of customers as churn in this industry is considered to be relatively low. The company expects 30% CAGR to revenue growth through 2024, and trades at a lofty 40x sales multiple. It has had a healthy pullback as year end portfolio rebalancing saw money flow out of growth, now representing a strong buying opportunity for the stock.

OKTA - Blue Sky BreakoutThis is the infamous Moonshot blue sky breakout play here for OKTA. Just had news that it is being added to the NASDAQ 100 as well, so this should see a nice pump. Going long on break of 254, with the following price targets:
PT 1: 258.89
PT 2: 269.76
PT 3: 279.27
I personally use OKTA for work as well and it is a gamechanger. With large enterprise companies shifting their focus rapidly to ensuring a better-connected tool stack ecosystem, OKTA has been a massive beneficiary of the acceleration of digital transformation.

$OKTA nice push from 50 MA. In Jan 15 260C since yesterdayquite a reverse move today after yesterday's flush to 50 MA. close above 251 would be solid this week for continued momentum. In in Jan 260C yeste

OKTA 251, 232, 220: A retracement based on time symmetryResistance is at 252 and 1st support is at 227 (closed to 232 right on the MA), next target 220, the purple channel support line.

$OKTA held 50 MAheld 50 MA and barely above 20 MA so far. If it closes above 20 MA (233) and market condition improves should get back to original levels

OKTA Earnings Analysis $230 CA butterfly centered around 240, 15 wide would be ideal as strong support is at 224 for VWAP and 230 for .681 fib. Hull is still up and green and symmetry say higher. OKTA 230 closed, gap higher to 240?

$OKTA with a Bullish outlook following its earning releaseThe PEAD projected a Bearish outlook for $OKTA following its earning release after a positive over reaction following the announcement placing the stock in Drift B
If you would like to see the Drift for another stock please message us. Also click on the Like Button if this was useful and follow us or join us.


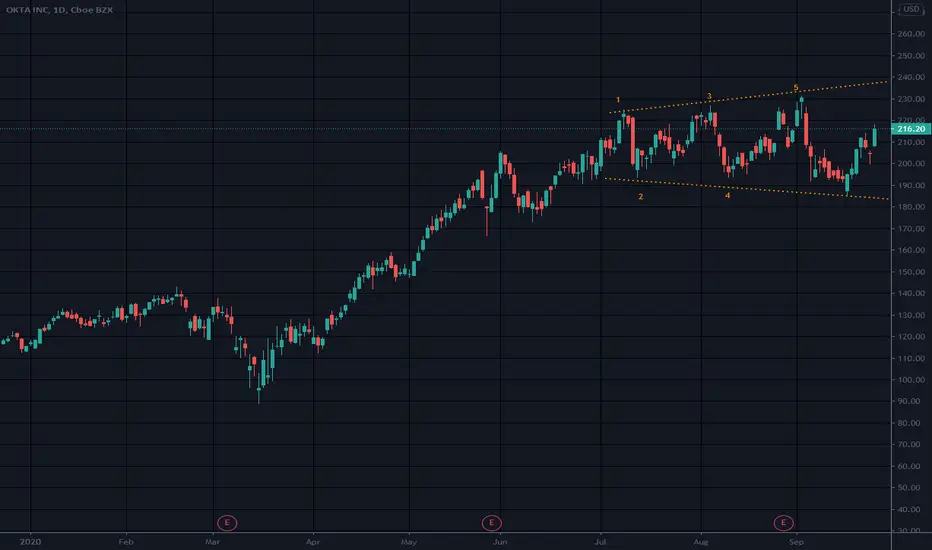
OKTA MEGAPHONE (possible warning!)Looks like Okta is moving towards the top of the megaphone. That could signal danger in coming months.

$OKTA - enough for meWatching this one intra day for a call option entry. It does not have all the technicals pointing in the ideal direction, however the trends show potential for it climb a bit more.


On watch for a cloud resurgenceBack in the consolidation zone, breakout lead to a nice move last time.

ABC BullishPattern only valid at or over LE level with an uptrend
Possible T2 284.5 to 307.7. These are long term targets
Possible stop below C
NV is high OBV is high showing large players interest
Negative Volume (NV) is volume on down days. Positive volume is volume on up days, which is usually when the general public buys
No rising wedges in yearly chart
Just an observation

Catch the pre-earning movementOKTA it is difficult to go more down. Expecting a pre-earning bull run from here.

Megaphone Pattern?Megaphone pattern is a pattern which consists of minimum two higher highs and two lower lows. The pattern is generally formed when the market is highly volatile in nature and traders are not confident about the market direction. Normally this pattern is visible when the market is at its top or bottom.
Also referred to as an ascending broadening wedge and an inverted triangle. This pattern appears after a strong trend up or a strong trend down
When the pattern is forming it represents that the bulls and bears are fighting to build control of the stock.
The pattern takes place when the bulls take the prices higher.
At the time of formation of the Megaphone Top, then again, bears make the prices fall because of which lower lows are formed.
There are bearish megaphone patternis and bullish ones as well. Neutral/just an observation
I guess if you really like this stock you can swing trade inside of it
Not a recommendation
OKTA - Triple Top??OKTA has formed a triple top pattern (potentially bearish). Despite the last top to be higher than the 2nd, a bearish divergence formed and it came down very quickly to the "neckline" @ 193. The odds of it breaking below 193 have increased and should it have a close below 190 then the downward trend is set in motion until the next support @ 173-177
Disclaimer: This is just my own analysis and opinion for discussion and is not a trade advice. Kindly do your own due diligence and trade according to your own risk tolerance. Thank you.

OKTA Triple TopOKTA has formed a triple topping pattern, which is a big sign for a breakdown. I expect this to break 193 support and head lower to the next level of support at $175 range. It has also already tested this support level 6 times, with each test weakening the supply.

OKTAOKTA needs to clear $230. Showing some RSI divergence but it is consolidating after a nice run from March


$OKTA Potential Long Above $209
As earnings approach we may get a rally into the Aug 27th print.
Potential level of resistance now on the weekly which we clear above $208
Upside target $215
