X trend holds FIB targets in playX trend break then we retrace to fib retracement points. For now no need to put in play as we are holding trend. Could continue to targets.
0LJ9 trade ideas


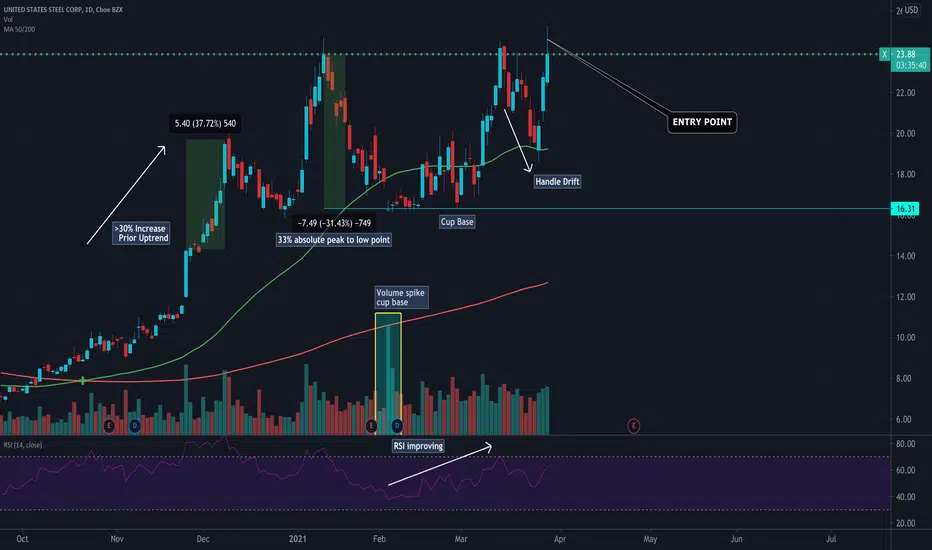
X Cup with Handle (Daily)Hot Potato Trader here, what is up fellow trader!
Key Points:
1. Cup with Handle pattern
2. Big Volume Clue at base of cup
3. 33% top of the cup to bottom of cup
4. > 30% increase price in prior uptrend
5. Improving RSI
6. U shape rather than V shape
One of the most important price patterns looks like a cup with a handle when the outline of the cup is viewed from the side. Cup patterns can last from 7 weeks to as long as 65 weeks, but most of them last for three to six months. The usual correction from the absolute peak (the top of the cup) to the low point (the bottom of the cup) of this price pattern varies from around the 12% to 15% range to upwards of 33% (as the case with this chart). A strong price pattern of any type should always have a clear and definite price uptrend prior to the beginning of its base pattern. You should look for at least a 30% increase in price in the prior uptrend, together with improving relative strength and a very substantial increase in trading volume at some points in the prior uptrend.
In most, but not all, cases, the bottom part of the cup should be rounded and give the appearance of a "U" rather than a very narrow "V." This characteristic allows the stock time to proceed through a needed natural correction, with two or three final little weak spells around the lows of the cup. The "U" area is important because it scares out or wears out the remaining weak holders and takes other speculators' attention away from the stock. A more solid foundation of strong owners who are much less apt to sell during the next advance is thereby established.
It's normal for growth stocks to create cup patterns during intermediate declines in the general market and to correct 1 1/2 to 2 1/2 times the market averages. Your best choices are generally stocks with base patterns that deteriorate the least during an intermediate market decline. Whether you're in a bull market or a bear market, stock downturns that exceed 2 1/2 times the market averages are usually too wide and loose and must be regarded with suspicion.
X: Primary, Ascending Triangle, Secondary, Bullish Pennant (79%)Primary Target:
Ascending Triangle, awaiting confirmation (54%)
PT = 37.28$
Secondary Target:
Bullish Pennant (79%)
PT = 43.70$

Infrastructure Bill helping SteelTechnical Analysis
We are breaking out to a 52-week high, with heavy volume (100%+ stronger volume intraday vs its 10-day average volume)
First measured move target is at $32, which is coincidental with a Fibonnaci 61.8% level.
OBV is supportive of the overall uptrend.
~~~
Take a look at USCR (US Concrete) which is rallying in my opinion based on the same infrastructure scenario.
If you would like a chart analysis on this symbol, please let me know.

United States Steel breakout on high volumeUnited States Steel jumped +10% this morning to $25.23 on high volume. Do your own due diligence, your risk is 100% your responsibility. You win some or you learn some. This is for educational and entertainment purposes only. Consider being charitable with some of your profit to help humankind. Good luck and happy trading friends...
*3x lucky 7s of trading*
7pt Trading compass:
Price action, entry/exit
Volume average/direction
Trend, patterns, momentum
Newsworthy current events
Revenue
Earnings
Balance sheet
7 Common mistakes:
+5% portfolio trades, capital risk management
Beware of analysts motives
Emotions & Opinions
FOMO : bad timing
Lack of planning & discipline
Forgetting restraint
Obdurate repetitive errors, no adaptation
7 Important tools:
Trading View app!, Brokerage UI
Accurate indicators & settings
Wide screen monitor/s
Trading log (pencil & graph paper)
Big organized desk
Reading books, playing chess
Sorted watch-list
Checkout my indicators:
Fibonacci VIP - volume
Fibonacci MA7 - price
pi RSI - trend momentum
TTC - trend channel
AlertiT - notification
www.tradingview.com

U.S. Steel is a Steal | Long X-Adjusted Q1 guidance upward, net earnings to $265M and $1.02/share from $160M and $0.61/share.
-Business fundamentals remain strong, and the company should continue to benefit from increased demand for steel from a strong global outlook
-U.S. Steel shares will benefit from a weaker dollar, continuation of steel import tariffs, and upcoming Infustracture spending bill
Short Term Trend Up, 20MA > 50MA
Stoch RSI, Buy Signal
Expecting breakout on this third touch of 24.50

𝗨𝗦 𝗦𝘁𝗲𝗲𝗹 𝗨𝗽𝗱𝗮𝘁𝗲: $X Daily. Cup & HandleHas developed into a massive C&H ... wow 👀 ... keep your eyes on this one folks
$FCX $AKS $MP $HG_F $CL_F $SPY $SPX $ES_F $TNX $TLT $ZB_F $ZN_F #Economy #Commodities #Inflation

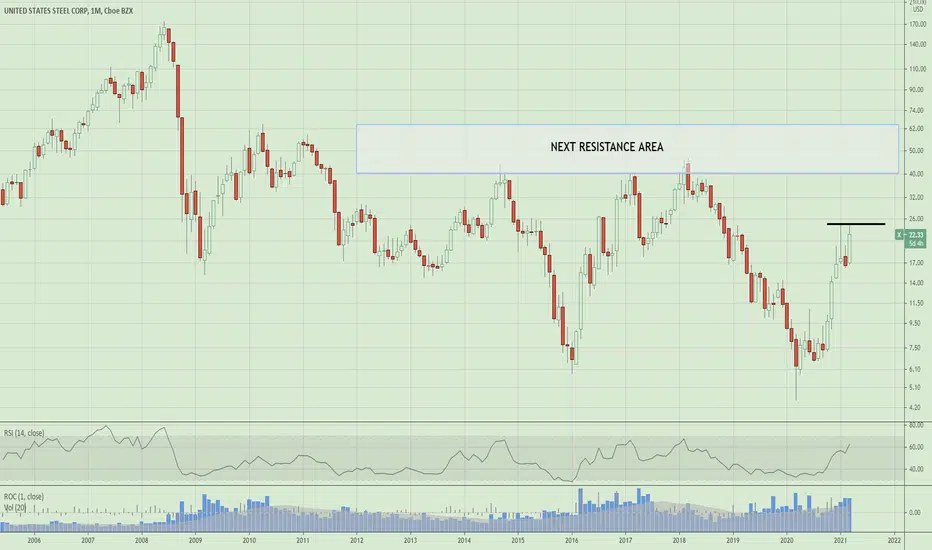
$X US Steel monthly chartThe optimal time to be purchasing shares was in March 2020, but a break above $24.70 could set up for a move to the $40-60 area. Talk of infrastructure spending could keep a nice bid under this steel stock over the next 6-12 months.

History repeating? Bullish run starting once again for XBullish longterm bias for steel
looking for a breakout of the current handle to complete the next move up but this bullish move can only happen if china trade tensions are still high and steel is limited

X (U.S. Steel Corp) cup and handleAdded 2/3 position in calls already. Dip to 20.94 possible, will add third batch then for breakout

BUY $X PT 30 SL 20
Bullish Long Term Call Option Flow - pbs.twimg.com
Steel Shortages
About to break critical resistance, January Highs
Now above 8/21 EMA
Recovery play
Hard to put a cut loss on this because the support is so far down. Excellent support at 16.

The post COVID era Sentiment I always try to present the charts in a simple comprehensive format to prevent any confusion.
This is just my technical view, neither a fundamental comment,nor a recommendation to trade..!
Please review my track record and calculate the odds for yourself..!
You’re likes and comments encourage me to continue this.
Stay tuned great live stream and quality content videos coming soon..!


X forming a strong upward Trend.an interesting correlation with spy, but with its own idiosyncracies. broken some resistances while climbing through that channel.


X consolidation BreakoutI remember trading this at 10 over the holidays. should do well with upcoming infrastructure funding.
Purple box - Consolidation
Green lines - Fib targets
Stop loss - 20$
MACD -Bullish
RSI has room
MFI has room
VOL increasing
My only gripe is it's sitting at the top of bollinger bands right now which could me a 1-2$ in the next couple of days then a continuation

[ X ] United States Steel Corp short call vertical spreadLazy day, lazy trade.
My Iron Condor Hunter script indicated a potential iron condor for this instrument for the 12 - 23 range.
Let's check for the best setup for this signal.
(1) Basic TA to background check
After a quick TA I judged it too risky, because it limiting the downside potential correction.
The script indicated good ranges in the past 4 years, but now I'm a little bit hesitating about the downside move limit.
The script shows me 12$ as secury bottom target in the next 30 days, but the lowest low may be ~10$, based the green trendline
(2) Murrey Math levels
-1/8 and +1/8 are used for some kind of attempt to catch a trend reversal. -1/8 is an extreme support level during a bearish trend , while +1/8 is an extreme resistance during a bullish tendency.
A test of these lines indicates that the current trend is weakening. As a rule, the price doesn’t revers here and starts corrections towards 0/8 and 8/8. After that, the previous trend resumes.
On the weekly perfectly fit to my Murrey Math Lines Auto +1/8 script.
(3) Daily divergence
Divergence on daily chart , without any more comment..... Indicated local correction.
Breaked down my custom oscillator => correction validated.
CONCLUSION :
Modifying the strategy from the originally planned Iron Condor to Vertical Spread.
Sell 1 X Apr16' 21 call
Buy 1 X Apr16' 23 call
Max profit: ...... $80
Max loss: ......... $120
IVR: ................... 18.3
Probability of Profit: 73%
Expiry: .............. 45days
Strategy: Short call vertical
Risk management: I'm closing the trade immediately - if the daily bar closing outside my strikes - and I'm cutting my loss. (no matter what I'm believing)- usually I'm losing mutch less than my max profit in this case. Danger zone starts at 20.28$
Profit management: I'm sending an order at the 50% of max profit, immediately after my position opened - as usually.


I love you but it time. Us Steel, its been fun. We had lots of sex in the back of 7Elevens. Enjoyed some cocaine in casio bathrooms. But its time to short you like some Biotech penny stock getting pumped by Cidadel. No hard feelings, its more me than you. But once your divergence shines again. ill call you at 3 in the morning drunk on old english and wreaking of strawberry vape juice. Then ill ride you like the titanic, end prematurely and seaman going in every direction. So thanks for the memories!

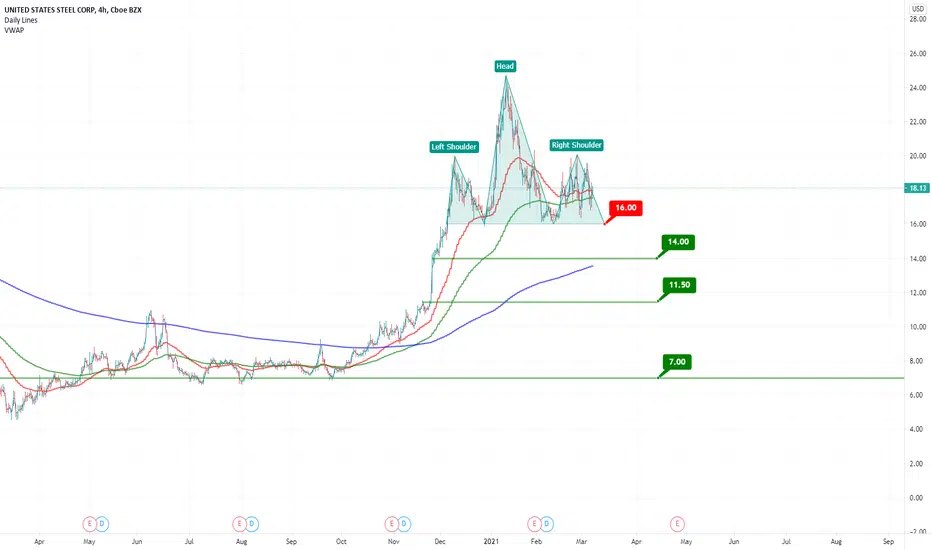
X Putting in a TopGross price action in X. This is a clean head and shoulders topping pattern. Steel stocks look atrocious. This would be a top pick for anyone looking to short next week. I do not have a position.
