$LVS 1D Ready for a breakoutLVS 1D is looking bullish and primed for a potential breakout soon. I like calls above 62.76 into April or further. My price target is 70.
0QY4 trade ideas

LVS up to 70 (pre-covid levels)Going up in pre-market, good TA patterns, volume divergence etc.
Put/Call Volume Ratio 0.12
Put/Call Open Interest Ratio 0.29
News:
Las Vegas Sands is selling the Venetian casino resort and Sands Expo and Convention Center for $6.25 billion.
In the two-part deal, VICI Properties will buy the property and all assets associated with the Venetian Resort Las Vegas and the Sands Expo for $4 billion. Apollo Global Management will acquire the operations of the Venetian for $2.25 billion.

shortttstuck between 35-65 for 10 years. clearly no growth. and its near the top resistance. could be a great entry for some puts. but id look for some plays that actually move haha.


LVS Ready for new highsLVS looks ready for wave 5 of 3. Followed by a decline in wave 4 and one more high to finish a cycle.

LVS - Las Vegas SandsLVS
ENTRY = 48 - 50
Cost Avg Down = 42 - 43
1st Target = 53
2nd Target = 58
HODL Target = 65
______________________________________________________________________________________________________________________
This content is for informational, educational and entertainment purposes only. This is not in any way, shape or form financial or trading advice.
Good luck, happy trading and stay chill,
2degreez


LONG LVS!Looking at this chart, BEAUTIFUL dip to buy. Im in at 50.52, looking for an exit around 60-70 within the next 2-3 weeks. All my opinion tho, trade at your OWN risk!

Las Vegas Sands earnings today at 4:05pmLas Vegas Sands earnings today at 4:05pm. My range is low $48, mid $53, high $58.
4th Quarter December 2020
Consensus =
EPS: ($0.30)
Revenue: $1.25 Billion
Do your own due diligence, your risk is 100% your responsibility. You win some or you learn some. Consider being charitable with some of your profit to help humankind. Small incremental steps work : If you double a penny a day for a month it = $5,368,709. Good luck and happy trading friends...
*3x lucky 7s of trading*
7pt Trading compass:
Price action, entry/exit
Volume average/direction
Trend, patterns, momentum
Newsworthy current events
Revenue
Earnings
Balance sheet
7 Common mistakes:
+5% portfolio trades, risk management
Beware of analysts motives
Emotions & Opinions
FOMO : bad timing
Lack of planning & discipline
Forgetting restraint
Obdurate repetitive errors, no adaptation
7 Important tools:
Trading View app!, Brokerage UI
Accurate indicators & settings
Wide screen monitor/s
Trading log (pencil & graph paper)
Big organized desk
Reading books, playing chess
Sorted watch-list
Checkout my indicators:
Fibonacci VIP - volume
Fibonacci MA7 - price
pi RSI - trend momentum
TTC - trend channel
www.tradingview.com

200EMA turning from resistance into supportThis might even reverse here IMO
Volume above avg is a good sign and i like that last candle


IRON TARIHi guys!
New Iron condor, check my last trades, and get my script for free!
Enjoy your wallet!
Tari.

LVS where next?LVS sold off and gap filled on Friday. interesting spot since we should in theory see demand buyers here and assuming market participates.
50.5 would be a better buy, but this isn't a bad area. I'd be cautious as earnings are just around the corner. There were some March LVS option sweeps that looked interesting

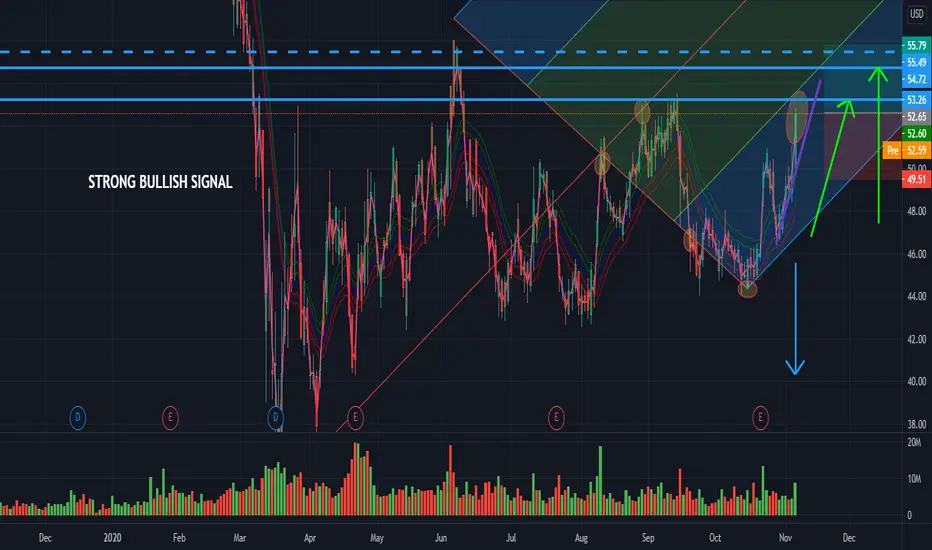
Hold or fold? #stocksNot sure if it was the Adelson news but LVS is the biggest loser in my portfolio today and is approaching a key level that will determine my next move. I was playing for a breakout above the range (rectangle) above 56. The stock held the highs of the range for over a month but has now slipped back into the range and is approaching the line in the sand at 53. If the stock can stay above 53 then I will stay at the slot machine a little longer and hope for some better performance over the coming days and weeks. Below 53 will force me out and I will have to re-evaluate my next move.


Is it time to gamble?LVS appears to be holding strong above its range state with the potential to continue upward. If the vaccine gap holds, around the 52 area, and net volume remains positive then LVS looks like a solid breakout candidate.

Can Las Vegas Sands Climb a Wall of Worry?Las Vegas Sands jumped on November 9 when news of Pfizer’s vaccine hit. It’s consolidated since, and is now showing some potential signs of continuing higher.
The first pattern on LVS is its gap above the previous high around $56. The shares have held their ground above those old highs, suggesting it’s found support above old resistance.
Next is the higher low in the last three sessions. That’s resulted in a basing pattern above the old resistance.
Third, you have yesterday’s bullish outside day.
Finally, the 50-day simple moving average (SMA) recently rose through the 200-day SMA – a golden cross. (This chart also features our MA Speed custom script.)
LVS hasn’t shown much of a turn yet fundamentally, but there is a path toward improvement. First the U.S. vaccine. Then the potential for the Chinese New Year on February 12 to revive visits to Macau. Stocks in the position of LVS have the potential to “climb a wall of worry.” Some of the chart patterns cited here might suggest that the turn is coming.
TradeStation is a pioneer in the trading industry, providing access to stocks, options, futures and cryptocurrencies. See our Overview for more.

$LVS swing trade idea$LVS just broke up words out of a bull flag. look for the price to break above resistance at at $60.46 wait for the price to close above and make this support. for best results u want this to break and close above on at at least on the 1 hr time frame. the look for entry as close to support as possible with at stop loss at 1 ATR below this support. 1 ATR on the daily time frame. witch on this stock is $2 for best results this is why u want a stop as close to support as possible. the first profit goal would be at 69.66 and second longer term would be 1.618 fib ext at $73.42. if trend continues using the ATR to set a trailing stop should work well to stay in this up trend as long as possible. happy trading stay healthy and have a great holidays. trade safe make sure to proper risk management in your trading and be consistent this is a marathon not a sprint stay in the game and on your path for there is no two the same. what someone else will all ways do better just strive to do better than u did the day before be the best u that u can the rest is just noise.

LVS-0.47*MAR $LVS Las Vegas Sands vs. $MAR Marriott IntlQuantamental Tools for Proprietary and Retail Investors.
Statistical Arbitrage Opportunities Delivered to Your Inbox.
QuantChart. io
Short 100 $LVS
Long 47 $MAR
Mean Reversion Time: 10 Trading Days

LVS LongLooks like Bull Flag
Fib# 38.2 as support
Entry 55
Stop 50
target: 70;
I am not a PRO trader. I need few months to practice trading strategies.
If you like this idea, please use SIM/Demo account to try it, until my trading plans get high winning rate.

[Long] LVSLas Vegas Sands has been in a bullish trend lately on China strength / reopening (Macau).
Interesting action where this level has held as support several times. IMO, can use this level as risk management.
Declining volume after the last peak suggests low selling pressure / successful consolidation.

LAS VEGAS SANDS CORP Title DailyHey people, LAS VEGAS SANDS CORP is in a bullish push with a trace of sellers and purchase volume made. In the TIMEFRAME M1 we see a form of doji bull with a large buying volume strong possibility of breaking the price to go to the next higher (See TIMEFRAME H4). Then if the buyers are really in the game, go to the next high, close the bearish breaking gap between resistance to pass (See TIMEFRAME H1). And finish on the Daily to test the intermediate median of ANDREWS PITCHFORK.
Please LIKE & FOLLOW, thank you!