RR=2 buy idea Bullish crab pattern + strong RSI divergence
PS : never risk more than 2% of your capital per trade
MANAUSDT trade ideas

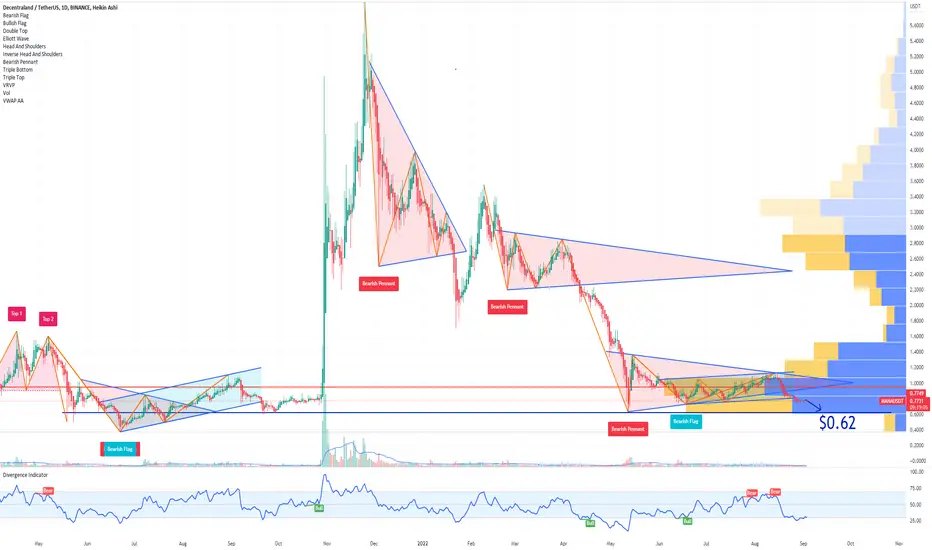
MANA Decentraland Price PredictionIf you haven`t sold the huge Head and Shoulders Bearish chart pattern:
Then you should know that Grayscale expressed concerns over the potential impact on the Ethereum Merge, especially on tokens that run natively on Ethereum:
The Merge may lead to a fork that might have unexpected and unfavorable outcomes and a scenario where stablecoins and tokens locked in smart contracts might not be redeemable.
Token and stablecoin holders might panic and start liquidating their holdings.
In this context, price target for MANA Decentraland is $0.62.
Looking forward to read your opinion about it.
MANA DECENTRALAND on to new lows!S* coin with s* price actions. Same will come for DOGE (currently at MANA'a yellow 4) and others
Already broke down from the recent bear flag and new lows just a matter of time. Ultimate target remains $0.13 and lower
Unless it breaks the downtrend line with confirmation
Hold my beer pls
----
No financial advice, do your own research, don't be stupid

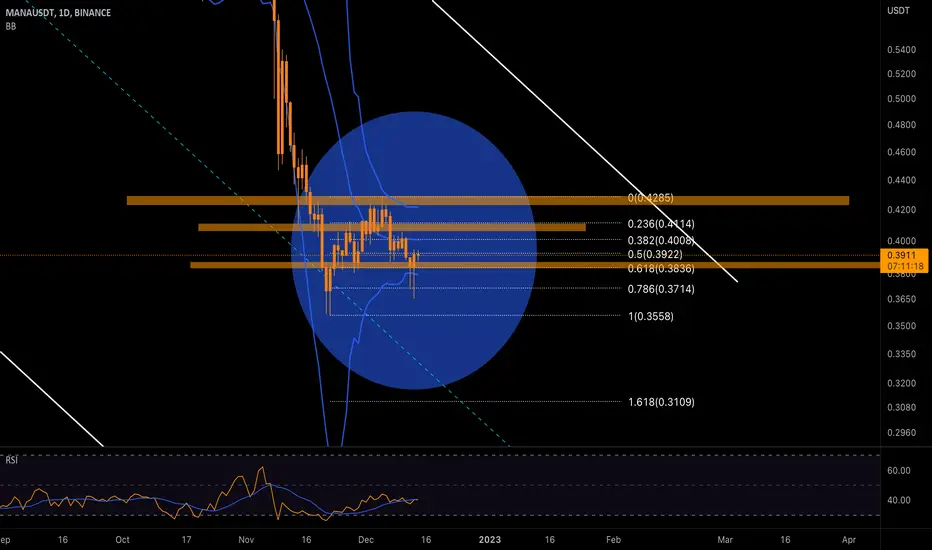
MANA - Technical review and analysisDuring the last week, MANA has registered a range trend between the specified levels. After the resistance level of $0.410-$0.417 was not completely broken, we again saw a decline in the price for MANA to the indicated support. Support is seen in the $0.362-$0.370 range, and a very positive reaction is seen at this level. Mana has grown by almost 7% from this area, which due to the short-term upward trend of Bitcoin and exit from the range channel, there is a possibility of the price of Mana continuing to grow and retesting the resistance level of $0.41.
But the resistance that can break the upward trend in the 4-hour time frame is considered in the range of $0.423 to $0.441. There is also a minor resistance in the range of $0.406 to $0.411, which is still close to this range in the lower timeframes. not seen Therefore, in the first encounter, we expect a negative reaction from this level. The closest support to the current price is in the range of $0.383-$0.387, which has seen a good positive reaction after breaking this resistance. So it can be a demand area for price growth. The formation of a positive RSI divergence can also help the short-term trend to rise.
MANAUSDT Descending Channel PatternMANAUSDT (4h Chart) Technical analysis
MANAUSDT (4h Chart) Currently trading at $0.391
Buy level: Above $0.39
Stop loss: Below $0.365
TP1: $0.40
TP2: $0.425
TP3: $0.44
TP4: $0.465
Max Leverage 3x
Always keep Stop loss
Follow Our Tradingview Account for More Technical Analysis Updates, | Like, Share and Comment Your thoughts

Bearflag - MANA-USDT (Decentraland) please read
Above, there is a bearflag that has formed over the last few months📆⏳
we are currently testing the bottom of this structure, if we break down↘, I have some targets listed above on chart📉🆗
Mana (currency of Decentraland ,)💧👨🦰👧👦🏬 is a token that is used to buy and sell virtual land in this metaverse much like Sandbox .
Decentraland current marketcap rank is #54 , with 734million dollar valuation and only about 8,000 DAU (daily active users) 👇👇
This is not a lot compared to other metaverse worlds like Sandbox 🛕🏝🏟 with almost 40,000 users a day and Alienworlds 🖖👽🛸 well into the millions of registered users...
This has concerned some holders and users as of recent, and we are looking for more traction around this metaverse to manifest.
As for now, the fear in the market being high and prices at record lows, we can expect to see further decrease in price before a recovery.
3HR view ☃⭐
Weekly view 👀👋
Related article⏩ futurism.com
🛑This is not financial advice🛑 Above are approximate targets based on fibs and major trend-lines etc. I always recommend looking at multiple charts when making a big investment, thank you!
Jazerbay ☯
Thank you so much!

MANAUSDT The moving averages gave two conformations and an entry signals for a sell, The n-wave formation is also on its last leg. TP is marked by the fib extension tool.

MANA Decentraland just corrective PA is clearly inside a bear flag with corrective wave pattern.
Since the intermediate took 4.236 on w3, expecting w5 to hit 8.236 < $0.33.
From there we will see if this remains a major ABC (green) or 5 wave impulse down (blue). If 5 waves down, final target will be below $0.13 - $0.16 (w3 on 2.618 => w5 on 4.236)
Invalidation only above $1.10
Hold my beer pls
----
No financial advice, do your own research, don't be stupid


MANA /USDT LONG +4%momentum
correction
liquidity
price action
market structure
liquidity
demand zone

#MANAUSDT 4H Chart
Price is ranging in an uptrend respecting a support line. MACD is not clear, RSI is neutral and EMAs are turning bullish. I expect price to fill the imbalance at $0.44 and reach the 7h supply at $0.446 before moving down from there.

MANA D-TimeFrame Trend Analyze>>>>>>
Hello EveryOne
I Have Tried My Best to Bring the best Possible outcome in this Chart.
In case of market support,
MANA can hit to the marked resistance's area' on the chart.
(mybe some more correction to support's area for earn more liquidity's)
MANA's long-term Static support is very important in longer time frame that must not break down at all in this scenario.
All important price in short term-mid term marked on the chart.
(reviewed by TrendAnalyze/Classic Pattern/oscillator's//Support&Resistance.)
It's just an analyze definitely not happen .
Not a financial advise.
PLZ DYOR
With hopping success>>>>>>>>>>>

MANA LONG SETUPHello, dear traders. how are you ? Today we have a setup to buy/long the MANA symbol.
For risk management, please don't forget stop loss and capital management
When we reach the first target, save some profit and then change the stop to entry
Comment if you have any questions
Thank You

Decentraland | Multiple Timeframes (Bottomed Out - Easy 46-90%)After a 94% correction from its All-Time High, we can say that Decentraland (MANAUSDT) already hit its bear market bottom?
Chart | MANAUSDT Weekly
Most likely, for some people maybe not but here is what the chart says will happen next.
Looking at the daily timeframe, we can see that MANA's multi year low was hit 22-November.
The day before bear volume was strong and right after the 21st it started to decrease.
A bounce can easily happen to the counter trend-line and even higher to reach MA200 at 0.7816 but wait... There is more.
The bear market from ATH to the 22-Nov-2022 low took exactly 364 days.
This might be a short bear market for some but we know from past history that Altcoins tend to correct from 90 to 98%.
Here we have once more a nice setup, low risk and high potential for rewards.
The stop-loss can be set below the 22-Nov. low, while for the targets we aim, All The Way Up!
Namaste.

MANAUSDT looks BullishLooks like MANA is planning to take a flight hope btc doesn't disturb the pattern
trade with caution and do your own research too

MANA Can Go Up From Here🔥Hello my friends, MANA might target from here 0.50
BUY: 0.4
TARGET: 0.5
Enjoy the trade

$MANAUSDT UPDATE!!!Hi Snipers,
Please refer to the recording for the next price levels and scenarios.
Thanks
MS

BREAK OF STRUCTURE AND RETESTIdentifying break in market structure and waiting for market to retest those key levels before taking an entry based on bearish candlestick formation

Return of manaMana is starting to show signs of come back. On 1D chart beautiful fractal beginning to shape its way up

MANAUSDTHello Dear friends
We are currently above the midline of the long-term descending channel and a positive RSI divergence has been issued on the daily time frame.
In the lower time frames, the support ranges have been maintained, it seems that the possibility of forming an upward trend up to the blue range ($0.4854) is high.
But it should be kept in mind that if the corrective trend falls below the range of $0.4252, the possibility of a further decrease to the lower areas will be strengthened.
We would be happy to hear your comments

🔥 MANA Is Leading The Fall: More Downside AheadMANA is currently one of the tokens which is leading the fall. Where most tokens have held their last week's capitulation lows, MANA is already trading 10% below it. I'm waiting for a break of the dotted support line.
In my view, there's more selling ahead. Keep in mind it's generally a good idea to short weaker assets instead of stronger ones.
Targets in blue placed at supports formed during the 2021 bull-run, scroll back for precise areas.

MANA the last chance (bottom) and the range market 📖🚀Hello 🐋
Based on the chart, the price is close to the major support (bottom) or better to say the previous zone that started its amazing pump to the upside and the round number $1 resistance that many times stop the price from more gain ✔️
if
the price breaks the round number to the upside, we will see more gain beside the range market is an acceptable scenario too 📖💡🚀
and
if the price breaks the range area to the upside, we will see more gain 🚀
Please, feel free to share your point of view, write it in the comments below, thanks 🐋

#MANAUSDT 2H Chart
Price is still heavily bearish and it is currently still ranging in a descending channel. MACD is not clear, RSI is sold and EMAs are bearish and working as resistance. Once price breaks above the resistance line we would then expect some bullish movements towards the imbalance around $0.6. Waiting for the breakout for confirmation.
