Short-term bullish reversal: above 2.606Hello?
Hello traders!
If you "Follow" us, you can always get new information quickly.
Please also click “Boost”.
Have a good day.
-------------------------------------
(MASKUSDT chart)
The key is whether the price can be maintained above 2.216-2.269 and rise above 3.592.
(1D chart)
It is expected that a full-fledged upward trend will begin only when it rises above 4.557-4.818.
The key is whether the price can be maintained above 2.519-2.606 and rise above 3.090.
If it falls below 2.519, it is expected to fall to around 2.111, so you need to think about a response plan.
Since a short-term resistance zone is formed in the 3.090-4.150 range, there is a possibility that the upward movement will be limited.
-------------------------------------------------- -------------------------------------------
** All explanations are for reference only and do not guarantee profit or loss in investment.
** Trading volume is displayed as a candle body based on 10EMA.
How to display (in order from darkest to darkest)
More than 3 times the trading volume of 10EMA > 2.5 times > 2.0 times > 1.25 times > Trading volume below 10EMA
** Even if you know other people’s know-how, it takes a considerable amount of time to make it your own.
** This chart was created using my know-how.
---------------------------------
MASKUSDT trade ideas

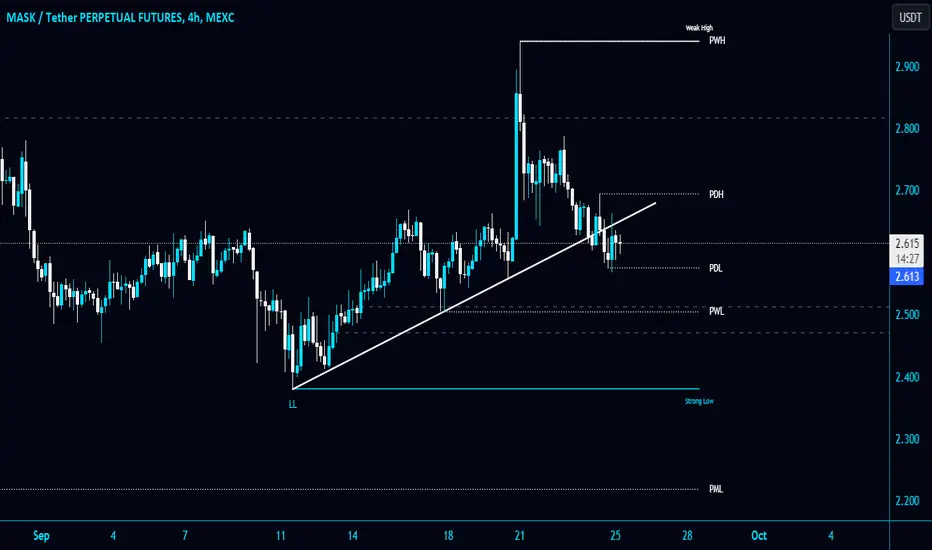
#MASK/USDT breaks the Diagonal Trendline in 4-Hour TF!#MASK/USDT breaks the Diagonal Trendline and unable to reclaim it in 4-Hour TF!
$MASK can retest PWL $2.505. The local resistance level is PDH $2.695.
$MASK will regain the bullish momentum $MASK ANALYSIS
$MASK is retesting the horizontal support at $2.6. If this daily candlestick of $MASK closes the “doji” pattern with the low volume that will show a reducing bearish momentum and $MASK will regain the bulls and pump soon. #RSI is suited to the neutral regions, but #MACD crossover is losing the bearish momentum.
Conclude: $MASK may pump in the next 3-4 weeks.

MASKUSDT 8HRounding Bottom Pattern on #MASK 8H chart. If it clear the neckline + EMA200, expecting upward movement to $3.22 and $3.49

MASKUSDT IDEAHello Trading view Family / Fellow Traders.
I hope you have used and benifited from the previous analysis .
In today trading session we are monitoring MASKUSDT for a buying opportunity,
MASKUSDT UPDATE
Falling Wedge Upside Breakout is Already Done in 1D Timeframe..
Expecting Massive Bullish Wave.
Moving As Expected Running In 60% Profit ✍️

MASK/USDT Broken Out of a Descending Channel | What to Expect? 💎Paradisers, be on your toes! MASK/USDT is showing signs of breaking out of its descending channel and is currently cruising within a demand zone. We're optimistic about a potential bullish ascent.
💎Recently, MASK has been oscillating within a defined bracket. It encountered a barrier at a bearish order block near the $3.34 mark. With its current bullish undertones, it seems poised to retest this barrier.
💎Watch out for the looming supply zone and the bearish order block identified on extended time frames; these might be on the MASK's radar next.
💎However, if the price dips beneath the demand zone and crucial support, brace for a possible bearish shift.
💎Stay sharp and keep those charts updated for more insights! 🌴

$maskreclaim blue line and we should accelerate.
invalidation below $2.380
above 200 ema on H1 may tag it, hopped on here anyways looking for yellow line as target

#MASKUSDT #LQR #TOBTC #LaqiraProtocolThe price is below the dynamic resistance in certain ranges after confirmation and matching with Bitcoin levels you can open a position This analysis is not an offer to buy or sell

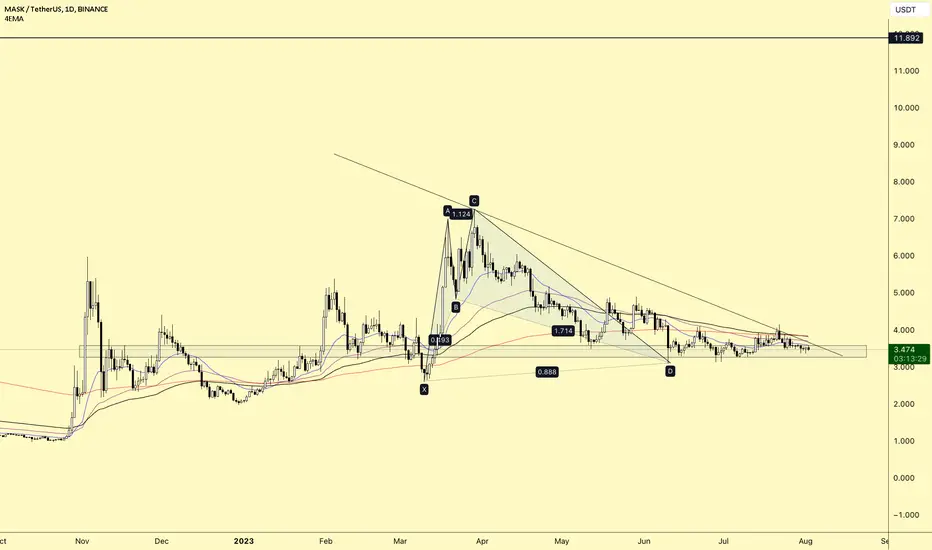
✴️ Mask Network Higher Low (150% Potential, Easy Target)Mask Network is preparing for a new bullish wave that can go beyond 150%, in fact, this is the easy target as a higher low can lead to a higher high and this is what we have here. Relative low Dec. 2022 vs higher low August 2023.
This chart is fairly common.
The drop while really strong in August has no volume, indicating that this is a reaction of sort rather than the start of a new bearish impulse. This statement is further supported by the fact that prices remain within a higher low as mentioned above.
When a move is real or the start of a new impulse it tends to be supported by high volume.
Once prices start to grow we should see volume rise.
Easy target 150% but prices can go much higher in this bullish wave, maybe 10 or 12. (Do your own research of course, this is only my educated guess).
Namaste.


#MASKUSDT 8-2023Mask Network is a decentralized communication platform that allows users to send and receive encrypted messages, files, and links on social media platforms. Mask Network uses the Secret Network blockchain to encrypt messages and files, ensuring that only the intended recipient can view them.
Coin rank: MASK is the #109 ranked cryptocurrency by market capitalization.
Coin sector and project: Mask Network is a decentralized communication project.
Category: Mask Network is a privacy coin.
Add to watchlist!
Note:
This isn't financial advice, but an analysis of coin movement (not a buy or sell signal). Before following any ideas, do your own research and practice good risk management.
You can't impose your opinion or force it to happen in the cryptocurrency market. So, be prepared for any outcome.
Remember, the cryptocurrency market is highly volatile and involves both gains and losses. Understand the risks before investing.
Good luck to everyone, and we hope that Allah reconciles and repays us all. 🙏

MASKUSDT crazy rally ahead?This is truly a crazy setup, especially if we look at the RR. Although there are still quite good chances that it might play out.

$MASKD3 stoch cross invalidation below white line or range low which has been reclaimed for now.
targeting dotted line then buy the pull back

MASK/USDT (Long)Cleared liquidity and again gained strength
ENTRY
2.5 to 2.75
OTE: 2.6
TARGETS
2.80
2.85
2.9
3.1
3.3
3.6
3.9
4.2
4.5
4.9
5.3
5.7
6.1
6.7
SL
2.414

SasanSeifi 💁♂️MASK/USDT 👉1W🔻 LONGTERMHey there!
When we take a look at the weekly timeframe, we can see that the price has taken a dip from the $4.80 range and has now reached the $3 support level due to some selling pressure. At the moment, it's trading within the range of $3.56, showing a period of consolidation with a positive response to the support level. Looking ahead, there's a possibility of further price correction in the long term.
Let's explore a scenario in the weekly timeframe: The price could Potentially continue correcting toward the price targets of $2.80 and the Fair Value Gap (FVG) range of $2.60, accompanied by price fluctuations. By Keeping an eye on the support levels and observing positive price movements on lower timeframes, we'll gain better insights into The continuation of the price trend.
To better understand how the price will move in the future, it's important to pay attention to how it reacts to the support levels. On the other hand, if the price breaks below the significant support level of $2.60 and remains stable below it, we might see a further price correction. Just remember that the key resistance levels in the weekly Timeframe are $4.20 and $5.
If you have any more questions or need further clarification, please feel free to ask.
❎ (DYOR)...⚠️⚜️
If you like my analysis, please Like and comment.🙏✌️

Twice rejected resistance | Short BiasDaily Chart
BINANCE:MASKUSDT is along ascending trend line and below resistance zone (4.0)
With RSI < 50 and RSI MA50 below 50, I think more likely MASK will down soon
I expect MASK will down to 2.65 and lower 2.0
Wait for next move

Mask support zone Mask coin
We also see since the beginning of the year that we are in an uptrend
As we notice, there is no selling momentum every time it touches the trend, showing the process of strength and respect for the uptrend
I expect the currency to rise from the current price
Targets in the chart
I apologize that my English is not good
Good luck to all
Did you like my analysis? Leave a comment, like, and follow to get more

Musk going to blast soon Recognizing the pattern in Mask Coin
Looking perfect for long , I predict 5.3 $
7 $
Accumulation phase is about to finish .
GOOD LUCK

MASK long-term plan
MASK is one of potential cryptos because of its fundamental (being backed by Binance, the world’s leading cryptocurrency exchange). It will have a lot of room to grow because of the low market cap of only $230 million (at today's price).
My long-term plan is presented in chart. By this, I suppose that MASK is forming an accumulation phase following Wyckoff method and we'll have opportunities to buy MASK much cheaper than its current price.
One important point is that the SC (event) would be lower than the referenced one. So I'll be ready for a second buy if prices go to $1 area (unlikely but everything is possible).
------------Information on MASK ------------------
Mask Network is a browser extension that bridges the gap between Web2 (the internet as we know it) and Web3. In other words, it enables people to access Web3 within existing mainstream platforms such as Facebook. The slogan of Mask is: your gateway to the new open internet.
Think of Mask (MASK) as a layer that adds privacy and functionalities to your social media accounts, allowing you to engage with crypto from your social media accounts. Mask connects Web2 giants such as Twitter, Facebook, and Instagram to blockchains like Ethereum, BSC, and Polygon."

$MASK$MASK/USDT
On the Daily timeframe level, the price action of $MASK Formed out Descending Triangle pattern as well as a Bullish Harmonic Shark pattern level where the price action is consolidating in a compression level on the Horizontal Support level
We can expect the bounce back level after the breakout of the MSB level. However, the price should close above the Horizontal Support level
Overview of Cryptocurrency Volatility - 1D, November, 2022.Analysis of the volatility index in November. Time interval - 1 day.
Currency - USDT or equivalent to BUSD .
The selection is carried out according to the lists of cryptocurrencies that are represented on the spot and futures markets, with a total of more than a hundred coins.
Top 15 Coins (1 day):
1. MASK /usdt - 361.63% (High&Low: 696.13%)
2. BAND /usdt - 337.16% (High&Low: 715.42%)
3. LEVER /busd - 279.01% (High&Low: 624.26%)
4. PHB /busd - 265.87% (High&Low: 816.13%)
5. SFP /usdt - 260% (High&Low: 543.59%)
6. DYDX /usdt - 228.3% (High&Low: 473.58%)
7. SOL /usdt - 224.96% (High&Low: 403.6%)
8. GTC /usdt - 221.38% (High&Low: 481.87%)
9. CHZ /usdt - 213.19% (High&Low: 415.79%)
10. CELO /usdt - 205.89% (High&Low: 380.34%)
11. C98 /usdt - 203.71% (High&Low: 405.97%)
12. REN /usdt - 203.28% (High&Low: 452.57%)
13. AMB /busd - 202.06% (High&Low: 553.96%)
14. APE /usdt - 201.33% (High&Low: 380.98%)
15. CRV /usdt - 201.2% (High&Low: 396.61%)
The coin showed the worst result: CTK /usdt - 69.79% (High&Low: 170.42%).
Full list of analyzed coins: www.tradingview.com
Analysis information for all coins: docs.google.com
Thanks for your attention!

Overview of Cryptocurrency Volatility - 1M, November, 2022.Analysis of the volatility index in November. Time interval - 1 month.
Currency - USDT or equivalent to BUSD .
The selection is carried out according to the lists of cryptocurrencies that are represented on the spot and futures markets, with a total of more than a hundred coins.
Top 15 Coins (November):
1. MASK /usdt - 73,79% (High&Low: 168,02%)
2. BAND /usdt - 65,23% (High&Low: 218,19%)
3. SOL /usdt - 56,52% (High&Low: 85,51%)
4. NEAR /usdt - 44,51% (High&Low: 64,77%)
5. LTC /usdt - 43,87% (High&Low: 65,54%)
6. REEF /usdt - 41,64% (High&Low: 85,66%)
7. APT /usdt - 39,85% (High&Low: 61,5%)
8. HNT /busd - 39,5% (High&Low: 61,75%)
9. KAVA /usdt - 39,08% (High&Low: 50%)
10. MANA /usdt - 38,64% (High&Low: 57,78%)
11. GALA /usdt - 38,23% (High&Low: 48,02%)
12. ANC /busd - 35% (High&Low: 57,89%)
13. LUNA /usdt - 33,8% (High&Low: 59,45%)
14. FLOW /usdt - 32,42% (High&Low: 59,34%)
15. SAND /usdt - 32,17% (High&Low: 53,61%)
The coin showed the worst result: BCH /usdt - 1.3% (High&Low: 33.91%).
Full list of analyzed coins: www.tradingview.com
Analysis information for all coins: docs.google.com
Thanks for your attention!

MASK potential profitI'm a trader and this is my latest trade and I'm learning to share my experience
Behavioral reason
@the weather is nice today
@earn experience
I'm not a teacher, I'm a trader, make a profit by trading, hope this trade goes well
