$1.50 is the Signal?Matic could make big move once the $1.50 resistance is broken, which can happen very soon (after 3 weeks consolidating - very bullish). My longer term target is around $4. Holding Matic is definitely a low risk play with decent upside imo.
MATICUSD trade ideas

Polygon (Matic) Poised for a Parabolic RunPolygon (Matic) has found strong support @ $1. Since the May crash Matic has been on a slow downward trend from the top @ $2.85 and bottomed out @ $0.64. Currently Matic is trading @ $1.47 and if Matic can flip this key resistance above the 38.20% fibonacci level into support above $1.77, Matic looks poised for a big move (95% back to ATH ) from this support zone. 185% Gain to the 161.80% Fibonacci target @ $4.22. See previous analysis below. Happy Trading :)
Polygon (Matic) Script Buy Signal triggered EMA Crossover SMA Confirms the Bottom and Reversal in Price back to May Highs near the ATH (145% Gain). See previous analysis below. Happy Trading :)
Polygon (Matic) has found strong support @ $1. Since the May crash Matic has been on a slow downward trend from the top @ $2.85 and the bottom @ $0.64, currently Matic is trading @ $1.04. Matic looks poised for a big move (175% back to ATH ) from this support zone . Happy Trading
Polygon (Matic) Update: 05 /08/2021: To Retest ATH @ $2.72 , Next Stop $3.24 @ 127.20% Fibs, then $3.94 @ 161.80% Fibs and $5.26 @ 227.20% Fibs. 121% Gain from current price to the 127.20% Fibs @ $3.24. Matic has been performing extremely well despite the blood on the streets...See previous analysis below. Happy trading :).
$Matic $Polygon
See Previous Analysis Below:
Matic New ATH $2.70 🎯(80% Gain from Buy Zone) Update: 18/ 05 /21 See previous analysis below. Happy trading :)
Polygon (Matic) Update: $1.78 Target Hit. Next Stop $2 at the 161.80% Fibs. 20% Gain from current price level to $2. Next Target after $2 at $2.58, 54% Gain from the current price level. See previous analysis below. Happy Trading :)
Polygon (Matic) Update 14/ 05 /21: Matic in Price discovery , our next target price $1.78 at the 227.20 Fibonacci extension . Targets Hit $1, $1.30, Next Stop $1.35 (7% Gain). With this continued momentum to the upside, it is a 43% Gain from current price level @ $1.24 to the 227.20% Fibonacci extension at $1.78. See previous analysis below :)
Polygon (Previously known as Matic) Update 27/03/2021) poised to test another New ATH @ $0.67 (15% Gain) from the current price @ $0.58. On the 25th April the 13 EMA crossed up above the 50 SMA signalling a strong buy signal, Polygon gained 70% from this parabolic move back to the ATH levels which were tested last in early March. Our next price target from here is $0.80 (37% Gain) to the 161.8% Fibonacci level. See previous analaysis below :)
Polygon (Previously known as Matic) Update 25/03/2021) poised for another test of New ATH @ $0.67 (93% Gain)
Polygon (Matic) poised for another test of New ATH @ $0.67 (93% Gain). From Buy Zone 1 Matic has retraced 18% and is now sitting in our Buy Zone to DCA and accumulate. If we continue to retrace to the 23.60% Fibonacci level, expect an explosive move back towards the 61.80% Fibonacci level @ $0.43 (47% Gain). Since reaching the ATH we have failed to break past the 61.80% level but a further retracement to the 23.60% should get the Bulls back in the market and we can expect to finally break through this level after 4 failed attempts from the current ATH . Huge parabolic move still on the cards here, be patient, DCA if you are already riding the wave or look to enter for a potential 93%+ Gain. See previous analysis below. Happy Trading :)
Update 20/03/2021
Since reaching a new ATH @ $0.57 after a Buy signal came from our script, Matic retraced down to $0.32 and is currently sitting in our Buy Zone to re-enter Buys to DCA /Accumulate at the 38.20% Fibonacci level @ $0.35. We expect another huge parabolic move for Matic to test the previous ATH @ $0.57 and further push towards the 127.20% Fibonacci level @ $0.67 in search of a new ATH , there is a potential Gain of 93% from the current price level. Be patient use current Buy zones to enter or re-enter to DCA /Accumulate from the current price level. Current Stochastics show an extremely oversold market and we are confident Matic will be in search of new highs in the coming days. Happy Trading :)
Update 20/03/2021
Nice set up from Buy Zone 1, potential test of the 50 SMA before bouncing back to the upside. #MaticUsd
*Update* Matic has hit our 161.80% Fibonacci Target @ $0.58. Great buy for everyone that got in and accumulated more coins at the critical buy zone areas.
Polygon (Matic) Buy Opportunity! Potential 68% Gain. Great Performance throughout the past month from Matic, this cryptocurrency is showing very strong continuation bullish momentum with HH and LL in a bullish range growing just over 240% over the past month. Matic seems to have found some resistance short-term between the 61.80%-78.60% showing indications of a weak retracement. Buy zone from current price level at 50% ($0.37) Fibonacci level for a sniper entry, but will also be looking to accumulate more coins around the 50% Fib level. Wait for price action, further confirmation from Stochastics showing oversold market before entering any Buys. Potential 68% Gain from Buy Zone 1 to 127.20 Fibonacci Level @ 0.68. The road to $1 Polygon (Matic) is clear. Use buy zones to map out your buys and DCA to accumulate more coins.
What is Polygon?
Previously known as Matic Network, Polygon is a framework for building interconnected blockchain networks.
It seeks to address some of Ethereum’s major limitations—including its throughput, poor user experience (high speed and delayed transactions), and lack of community governance—using a novel sidechain solution.
Rather than being a simple scaling solution like its predecessor Matic Network—which uses a technology known as Plasma to process transactions off-chain before finalizing them on the Ethereum main chain—Polygon is designed to be an entire platform designed for launching interoperable blockchains.
Through Polygon, developers can launch pre-set blockchain networks with attributes tailored to their needs. These can be further customized with a growing range of modules, which allow developers to create sovereign blockchains with more specific functionality.
Key Notes:
The race is on to be the first interoperability solution to go fully live. Polygon’s proof-of-stake chain and Plasma scaling solution are live, but developers can’t yet launch their own standalone or shared security chains on Polygon until these features are released. Likewise, neither ZK-rollups nor optimistic rollups have been launched on the network, with Plasma currently the only scaling solution available on Polygon.
Polygon’s rivals are also rushing to go live with their offerings. As of March 2021, Polkadot has yet to launch public parachains; and while Cosmos’ Stargate upgrade has seen the launch of its Inter blockchain Communication Protocol ( IBC ), it won’t become fully operational until IBC transactions are enabled on the network.

#maticstarburst off to the Race?!! Out of downtrend Now that Matic is out if it’s nasty little downtrend, it looks like it might be off to the races…Study I can see at pushing higher sooner then later Study…

Matic break-out, will it hold for the upside? The news of late has been positive so lets start september with a bang! who's with me?

#maticstarburst polygon uptrend?We have been on the floor so long is this the beginning…. Study? Of the launch

MATIC, The September PathVarious indicators point towards MATIC continuing its slow journey back to $2.00 within the next few weeks.

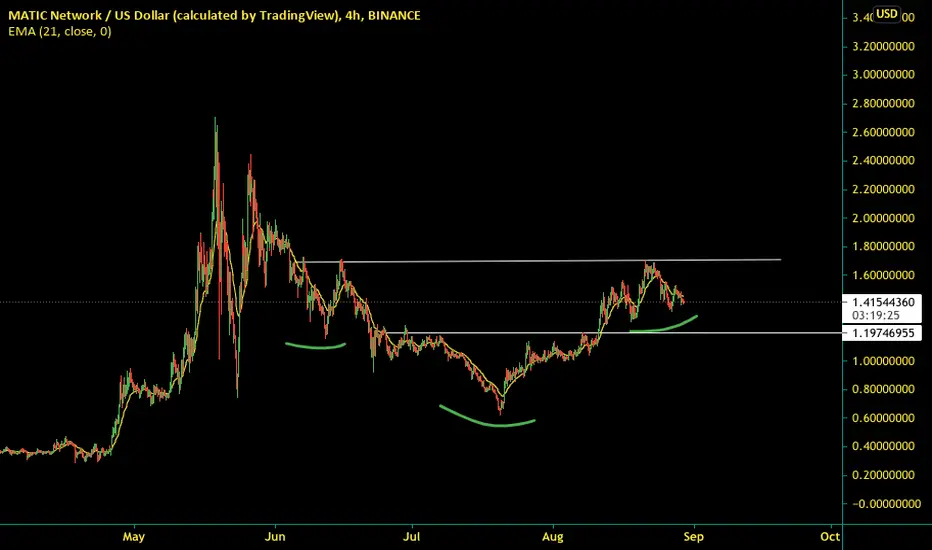
MATICUSD - LONG% Price is at macro uptrend since early February and also in a Macro symmetrical/Descending triangle.
%Fib Retracement 38.2% : Price is currently testing this level .
% If price broke out 38.2% and makes the phase 2 of up trending trendline ....... i will be DCA my long trades from $1.18 - $ 0.95.
% If price makes the Macro cup and a handle/ Inverse H&S ...... I will be entering at when the retest happens around $ 1.62.
% Since there is a possibility of bearish divergence from MACD & RSI ... i might wait till the pattern forms to enter unless there is volume supported bullish candle .

$maticup or down? which way shall we go? thinking we go up with $BTC but would like others opinion. why has Matic lagged so hard today while ALts pumped?


Matic Limit Order OpportunityTrading Capital of $3,400.
Price has passed through and retested the 50-61.8% zone.
Therefore, looking for an entry price of $1.389 based on the 78.6% retracement zone.
TP1 (half position) at Fib Extension 1.272%
TP2 (rest of position) at Fib Extension 1.618%

Polygon (MATIC) - August 30Hello?
Welcome, traders.
By "following", you can always get new information quickly.
Please also click "Like".
Have a nice day.
-------------------------------------
(MATICUSD 1W Chart)
If the price is maintained above the 0.68108424-0.74329777 range, it is expected to create a new wave.
(1D chart)
If the price is maintained in the 1.22720775-1.63364447 range, it is expected that the uptrend will continue.
However, it must rise above the 1.83686282 point to continue the uptrend.
If it falls from the 1.22720775 point, you can touch the 0.82077103 point, so you need a Stop Loss to preserve your profit and loss.
However, careful trading is required as it can touch the 1.07283403-1.16932176 section and rise.
-------------------------------------
(MATICBTC 1W chart)
If the price is maintained above the 1259 satoshi-1422 satoshi range, it is expected that the upward trend will continue.
(1D chart)
It remains to be seen if it can find support at the 2882 Satoshi point and move above the 3294 Satoshi point.
If the price declines from the 2882 satoshi point, we should see if there is support near the 2390 satoshi point.
If the price holds above the 2882 satoshi point, it is expected to move up to the 3823 satoshi-4293 satoshi section and re-determine direction.
------------------------------------------
We recommend that you trade with your average unit price.
This is because, if the price is below your average unit price, whether it is in an uptrend or in a downtrend, there is a high possibility that you will not be able to get a big profit due to the psychological burden.
The center of all trading starts with the average unit price at which you start trading.
If you ignore this, you may be trading in the wrong direction.
Therefore, it is important to find a way to lower the average unit price and adjust the proportion of the investment, ultimately allowing the funds corresponding to the profits to regenerate themselves.
------------------------------------------------------------ -----------------------------------------------------
** All indicators are lagging indicators.
Therefore, it is important to be aware that the indicator moves accordingly with the movement of price and volume.
However, for the sake of convenience, we are talking in reverse for the interpretation of the indicator.
** The wRSI_SR indicator is an indicator created by adding settings and options to the existing Stochastic RSI indicator.
Therefore, the interpretation is the same as the traditional Stochastic RSI indicator. (K, D line -> R, S line)
** The OBV indicator was re-created by applying a formula to the DepthHouse Trading indicator, an indicator disclosed by oh92. (Thanks for this.)
** See support, resistance, and abbreviation points.
** Support or resistance is based on the closing price of the 1D chart.
** All descriptions are for reference only and do not guarantee a profit or loss in investment.
Explanation of abbreviations displayed in the chart
R: A point or section of resistance that requires a response to preserve profits.
S-L: Stop Loss point or section
S: A point or section where you can buy to make a profit as a support point or section.
(Short-term Stop Loss can be said to be a point where profit and loss can be preserved or additional entry can be made through split trading. It is a short-term investment perspective.)
GAP refers to the difference in prices that occurred when the stock market, CME, and BAKKT exchanges were closed because they are not traded 24 hours a day.
G1 : Closing price when closed
G2: Opening price
(Example) Gap (G1-G2)

MATIC breaking out of confluence on airdropMATIC getting ready to blow again, broken down cup and handle pattern and showing a descending wedge in high time frames. A bit more news from the development team should be hitting twitter this week loaded up on on a starter position


MATIC is set to an possible reversal at this pointMATIC was making new higher highs and higher lows for the most of these two past weeks but now as we approaching the end of August things are looking critical for MATIC.

Matic If this works out as planned, then this is what I may be watching for depending how this wedge plays out here. As I see us potentially holding support here, and as long as we do… I entered at 1.4312 and keeping stoploss at breakeven… next peak could touch 1.80s and targeted downside move potential either 1.25 support or if it gets real back .93 would be start of wedge which usually is where a target ends up for a rising wedge.
1.25 would be back test of old resistance for Matic, as 41,400-42k would be for BtC
Not finantial advice and this is just my speculated idea
