1AMT trade ideas

AMT: - real estate long only I have always enjoy instruments like fixed income or long only where it is enough just to find an entry point below and buy in addition if you entered early.
As you can see on the chart, the indicators indicate that the price is currently in the oversold corridor, so I bet on growth.
___
Sincerely,
AJV


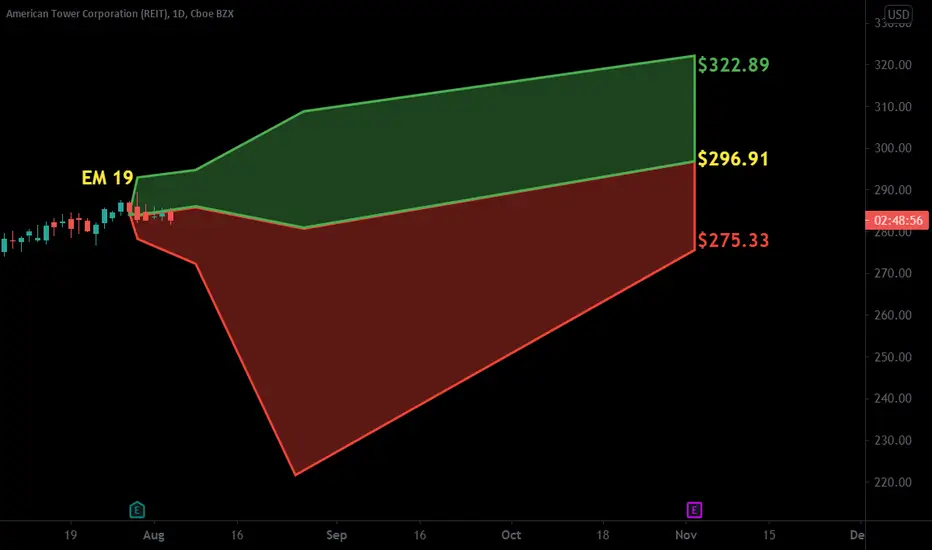
BULLISH OPENING ON AMTi will be long on AMT we are on a nice support area i think it will go 276.4 area in order to fill gaps and come back to equilibrium area


AMT , LONG AMT , retakes 10 and 21 ema and we have some rising volume signs . Another institution favorite .
Last play I will publish for a bit till some of todays ideas either get stopped out or I'm able to sell half at 2R to manage risk .
Long 128.15 vs 278.50

$AMT with a Bullish outlook following its earnings #Stocks The PEAD projected a Bullish outlook for $AMT after a Positive over reaction following its earnings release placing the stock in drift B
If you would like to see the Drift for another stock please message us. Also click on the Like Button if this was useful and follow us or join us.
AMTStrong uptrend with price action making HH and HL.. Wait for retracement back to the previous resistance zone

Golden Crosses in Wireless Tower StocksWireless-tower stocks have been in long-term uptrends as mobile devices and usage proliferate. American Tower is the largest of the three, followed by Crown Castle International and SBA Communications .
AMT has moved sideways for the last year. It hit an all-time high shortly before the coronavirus crash, quickly rebounded and then drifted sideways. Prices declined once bond yields started rising in September. (Not a surprise because AMT is a REIT.)
The stock had a sharp rebound in March and April, followed by consolidation this month. The most important chart pattern is the 50-day simple moving average (SMA) rising above the 200-day SMA. That’s a “Golden Cross,” a signal that longer-term momentum has turned bullish.
Also notice the $244 area. It was support last June and August, resistance in October and November and now is offering support again.
It’s also noteworthy that CCI already had its golden cross in April and has now broken out to new highs. For SBAC, the signal is on the verge of taking place.
TradeStation is a pioneer in the trading industry, providing access to stocks, options, futures and cryptocurrencies. See our Overview for more.
Crown Castle daily chart:
SBA Communications daily chart:

$AMT with a Bullish outlook following its earnings #Stocks The PEAD projected a Bullish outlook for $AMT after a Positive under reaction following its earnings release placing the stock in drift A
If you would like to see the Drift for another stock please message us. Also click on the Like Button if this was useful and follow us or join us.

MATRIX portfolio AMT/USD : Smart money levelsNo description needed.
I just spot where the value should be or where are the levels smart-money and institutionals traders and investors look for buy entry's, according to Fibonacci retracements.
NOT FINANCIAL ADVICE
MORPHEUS.

Pull Back Fishing Falling WedgeFalling wedges can be bullish when price breaks up and out of the upper trendline.
Not a recommendation.
Looks like a cup and handle pattern is also forming

$AMT with a Bearish outlook following its earnings #Stocks The PEAD projected a bearish outlook for $AMT after a Negative under reaction following its earnings release placing the stock in drift C
If you would like to see the Drift for another stock please message us. Also click on the Like Button if this was useful and follow us or join us.

AMT Target of $228 Rather soonOpinion Only; not trading advice.
Large option activity in this one for the $225, $217.50, and $270 strike last week.

Possible bottom AMT in this zone..Looking at a bottom in the area and the impact of 5G mobile on antenna business model for AMT.

250 PTLooks to be be ready for another leg up based on Fibonacci levels.
Stop near $223
Not advice, just observing

American Tower: Old Resistance, New Support?American Tower is the largest owner of wireless towers, and the largest member of the real-estate sector.
It’s been in a long-term uptrend thanks to the spread of wireless communications, having doubled between early 2017 and early 2019. It hit new all-time highs last summer, pulled back for half a year and now may be showing signs of a turn.
The first important pattern is the 50-day simple moving average (SMA). Notice how it held prices in check in September and November. However AMT is now trying to bounce at the same line. Is old resistance becoming new support?
Next, stochastics are oversold on the daily chart. A rebound here could help validate the 50-day SMA as support.
Third, MACD is now rising on the weekly chart. Similar crosses also signaled longer-term pivots in early 2017 and mid-2018.
Overall, AMT has struggled along with other REITS as interest rates increased. However, its business still stands to benefit from the spread of 5G networking. Is now the time for investors to revisit the longer-term growth story?
TradeStation is a pioneer in the trading industry, providing access to stocks, options, futures and cryptocurrencies. See our Overview for more.


AMT LONGNYSE:AMT
This is solely for educational purposes.
This is my first sharing. I am testing my strategy which is based on combination of fundamental and technical analysis. My objective is to find good investment opportunities.
Analysis
I notice the price is making a trend change upward after bouncing at FIbo 61.8. Do notice there is a strong resistance at the top @ 268.64. The potential reward is about 17-18%.
Strategy
I would place a LONG order at the high of the candle on 25 Jan 2021 @ 229. Stop loss ard 203. Profit taking ard the resistance which is 268.64.

AMT is at resistanceI am looking for a pullback on AMT. It is overbought, has bearish RSI divergence, and appears to be pivoting off of the 224 price point.
I do not have a position on AMT, I will be evaluating this trade on monday based on market direction.
Always use stop loss when trading - thank you for viewing my idea!


American Tower Corp (AMT) Classic Trend Following
Yesterday I took a nice short trade on AMT stock.
Reason:
down trend on daily/4h charts.
Trade was taken after a breakout of a bearish flag pattern and consequent retest.
Now stock is preparing for a new bearish wave.
First goal - 205

