$SNAPSnap is on a major support line dating back to 2008 huge bull flag formed and look at the indicators I expect 26 dollars price target soon.
1SNAP trade ideas

Falling wedgeposted chart yesterday on twitter, forgot to publish here, but beautiful b/o of falling wedge on $SNAP

SNAP possible breakout to the downsideSNAP broke out to the downside through an up trend and is now in the Kumo cloud on the daily chart and will find support around $21.20 then will either dump through or bounce back. Its a little oversold on the Stochastic indicator which helps me to see support around that $21.20 area. It broke through the Kumo cloud on the 4 hour and looks very Bearish.
RESISTANCE LEVELS= $21.80
SUPPORT LEVELS=$19.62 $18.93 $16.63
BIG PRICE GAP THAT NEEDS TO BE FILLED AT $13.30- $$14.48

SNAP wait for breakout confirmationhey everyone, If you enjoyed this analysis make sure to leave a thumbs up or comment your opinion below!
Snap is currently in a descending wedge wait for breakout confirmation and make smart trades!
Unusual Options Activity and DivergenceWe are still in bearish territory, but this could change sooner than you thought.
There were 69000 21. Aug 20 22.5 call @ 0.69 bought, which might seem a bit suspicious in terms of trading in any direction:)
And also a Regular divergence is showing off on the chart, which indicates a trend reversal. In this case: bearish> bullish.
Important levels in case of a breakout are 23.6%, 38.2% and 50% fib level. IF any of them hold strong, then we might easily test the 19.71 level.
Best regards, Benedek

Bull Scenario for SNAPNYSE:SNAP
If SNAP can hold this pattern and breakout, SNAP should break out of descending channel and head back to previous highs. If not, $19.70 is the price target for support.


SNAP to test previous support Hey everyone, If you enjoyed this analysis give it a thumbs up or comment your opinion below.
With snap sitting below all major ema's and below the moving average in the Bollinger bands I'm expecting a drop to the down side to test the support.
We can also see the BB starting to coil together which usually indicates a big move one way or the othe,r I'm hoping to short here!


SNAP PullbackNice short term play for SNAP. Tech sector has been on a roll from the march 2020 bottom, look for a nice pull back to at least the .382 fib. Fib support lines up with previous resistance and tested support zone


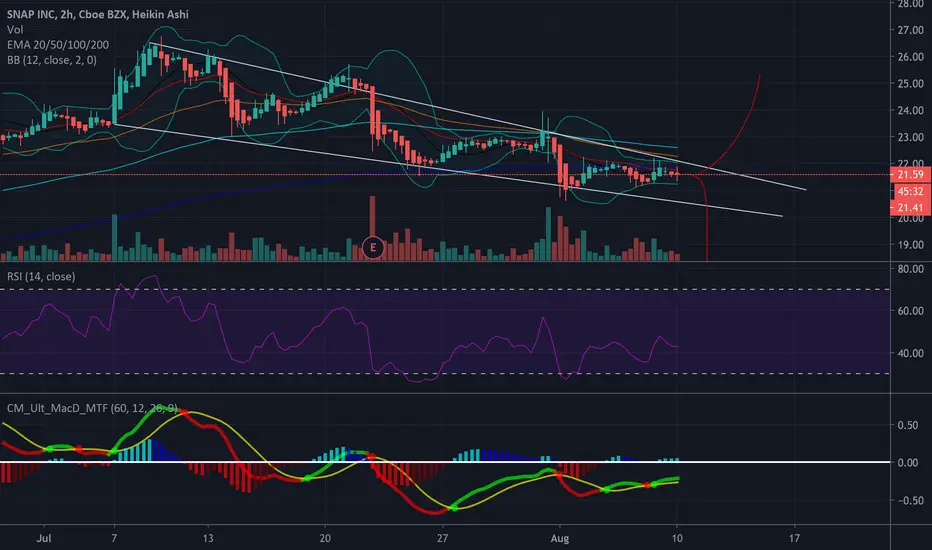
SNAP Testing Short-Term ResistanceSome technical ideas on Snap's recent movement:
Snap's price level is testing resistance at the 50 EMA around $23.00. This price zone acted as previous support throughout June and July. Additionally, the $23.00 zone represents a .23 fibonacci retracement from Snap's gap-up on April 21. A large amount of selling pressure occurred at the end of last week following Snap's earning announcement, which could resume depending on how Snap's price responds to the resistance @ $23.00.
If Snap's price can't confirm a breakout above the $23 resistance, I suspect that price will retest support around $20.00. I'm curious to see how much bullish volume Snap will see this week.
Comments are always appreciated!


Great opportunity to keep your short position on SNAPI see a great opportunity to sell the SNAP on the 15M...there is a high volume confirming a strong bearish move. Do not buy now!
