low momentum on previous resistance strong break up through resistance now retrace 50% fib.
previous resistance now become support
also if you check momentum indicator like MACD you will see bullish divergence
GDH2019 trade ideas

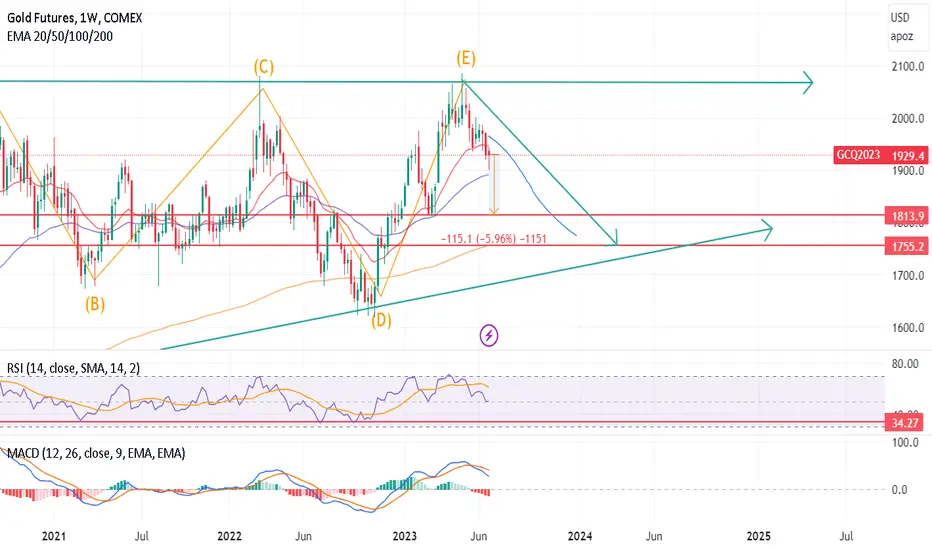
possible correction before going to the upsidegold has a weekly gap at 1870
and a strong support at 1815
also the macd shows a potential downside of 4-5% based on the above technicals
mentioned
inflation on may rose 0.1% which will strengthen the DXY index , and historically speaking they have an inverse relationship with the gold price.
dollar will be weak gradually and slowly when the inflation records 3% or less
Gold at a interesting juncture, which way now?Gold is at an interesting junction again, are we going go to hold the $1900 area and retrace or is this a more substantial bottom?
It's very tough nowadays to anticipate what the outcome will be because the market seems to be adopting not too many traditional norms.
So technically, it seems to have met a short-term objective around the $1900 area (38.2% retracement) and the weekly candle pattern highlighted has played out higher in the following weeks. I have highlighted the previous occurrences.
For me, I was always targeting $1905, so I will monitor for buying opportunities but a failure could see a deeper move to the $1850 (the 40% retracement point) area.
we could be settling into a $1900-$2000 range?

Gold's 12-Year Cup & Handle Pattern Signals New All-Time Introduction:
In the world of technical analysis, patterns often provide valuable insights into the future price movements of financial assets. One such pattern that has recently caught the attention of gold traders is the 12-year Cup & Handle formation. This classic pattern, characterized by a rounded cup shape followed by a smaller handle, is pointing towards an imminent breakthrough for gold prices, potentially propelling the precious metal to a new all-time high of $2,800.
Body:
Gold's journey over the past 12 years has been nothing short of remarkable, with several major price swings and prolonged periods of consolidation. This price action has created a massive cup formation, suggesting a long-term bullish trend for the precious metal. The cup portion of the pattern represents a period of accumulation, where investors buy gold at various price levels, creating a strong support base.
Following the cup formation, gold entered a period of consolidation and formed a smaller handle. This handle acts as a pause or a temporary retracement within the overall bullish trend. It represents a period of price consolidation, as investors take profits and new buyers cautiously enter the market.
Now, as gold's price approaches the upper boundary of the handle, technical traders are closely monitoring the potential breakout above the resistance level. This breakout, if confirmed, would complete the Cup & Handle pattern and signal a significant shift in the gold market. A decisive move above the handle's resistance would indicate a renewed wave of buying interest and could ignite a powerful rally towards the projected target of $2,800.
Several factors contribute to the bullish sentiment surrounding gold's potential surge. Geopolitical tensions, inflationary pressures, and global economic uncertainties continue to drive investors towards safe-haven assets like gold. Additionally, central banks worldwide have maintained accommodative monetary policies, which have historically supported higher gold prices.
Conclusion:
Gold's 12-year Cup & Handle pattern is a testament to the enduring allure and strength of the precious metal. As the price nears the upper boundary of the handle, traders are eagerly anticipating a breakout that could lead to a new all-time high of $2,800. While technical patterns are not infallible, they provide valuable insights into market sentiment and can guide trading strategies. As the gold market evolves, it will be intriguing to see if the Cup & Handle pattern manifests its predicted outcome, potentially fueling a renewed wave of optimism for gold investors.

GC1!: Expecting Bullish Movement! Here is Why:
The analysis of the GC1! chart clearly shows us that the pair is finally about to go up due to the rising pressure from the buyers.
❤️ Please, support our work with like & comment! ❤️

OH MY GOLD Hello traders,
GOLD (GC) has a super interesting setup, we broke the last trending line of the Pitchfork, and retested without success. And we can see that sellers got rejected with volume at the support 1913, today s session will decide. Be careful, i think gold will skyrocket whatever its doing right now, be prepared.
GOOD LUCK.

Gold India Price, may face downside Resistance at 61.8% FibGold India Price, may face downside Resistance at 61.8% Fib.
As per Daily Ichimoku Price will go in downside. Both Base line and conversion line are below cloud & Chikao span is also free from cloud downside, Suggesting strong downside moment..
Need to wait at 61.8% fib resistance to confirm if price will more downside or it will take fib resistance and move upwards.

Gold Near Support?Gold and Silver are getting hit to the downside this morning with jobless claims coming in softer than expected, continuing the downtrend for Gold since the highs from May. The Chinese Yuan weakness has been a major headwind for the Gold market since those May highs, but there is some strong support down near these levels at 1907.9 that the bulls will look to defend. A break and close below here could add more selling and send the market down lower near 1869-1875.

Bearish Gold Gold is trading in a bearish trend,im only searching for sell setups to avoid trading against the trend

Gold zones for tmwGiving yall the sauce on whats boutta go down tmw wdaoijawoijdawjojoiawdjioawdjoiawdjoijadwoijoiasjioawdjoiawdjiowadjoiawojiwajiojoiwadjoiwdajoiawjoidwadjoiwdajiojoiawdjoiwadjoiwadojiawdjoiawdojiwdaoijawdjoiawdojiwadjoiawojwadjoi

No reason to buy GOLDThe under going C wave of ABC zigzag correction may push the price of GOLD to drastic down
Falling crude price, rising stocks, are the main reason
India is started its sowing process which is also a diminishing factor
The Fibonacci targets are shown

Gold Mcx for Sell till 14 August 2023Sell Position in MCX Gold:
Entry Price: Market Price (at the time of execution)
Target 1: Around 57,100
Target 2: Around 55,000
Stop Loss: 58,900
chart Time Frame is : 7 hours
Entry / Exit Time Frame: 2 hours
Reason for the Trade:
This sell position is based on the analysis of the supply and demand zone, as well as the market being in a downtrend. The supply and demand zone indicates areas where the market has historically shown a strong presence of sellers. By identifying a supply zone, we anticipate that selling pressure will likely increase, leading to a potential decline in price.
Additionally, the market being in a downtrend further supports the bearish bias. A downtrend is characterized by a series of lower highs and lower lows, indicating that the sellers are in control and that the overall sentiment is negative.
Notice for Safe Traders:
For safe traders looking to hold the selling position, it is advisable to trail the position with a 9-period exponential moving average (EMA). The 9 EMA can serve as a dynamic level of resistance, helping to identify potential reversals or weakening of the downtrend.
It is recommended to exit the trade once the price breaks above the 9 EMA. This would suggest a potential shift in the market sentiment or a weakening of the selling pressure.
Please note that trading in financial markets carries risks, and it is essential to conduct your own analysis and consider your risk tolerance before entering any trades. This trade suggestion is based on the information provided and historical price patterns, but there is no guarantee of future performance. It is always recommended to have a well-defined risk management strategy in place.

GC - LnngPrice is GC is in a demand area inside a descending triangle. I expect price to retest the most most impulse move lower near 1960 before continuing lower to 1920

GC1!: Bearish Continuation is Highly Probable! Here is Why:
The strict beauty of the chart is a reflection of the fierce eternal battle between the bulls and bears and right now I can clearly see that the bears are taking over so we will bend to the will of the crowd and sell too.
❤️ Please, support our work with like & comment! ❤️

$GC1! Let's SHORT GOLDAlright. Here we have it. A beautiful set up for a lovely short. I believe gold is still in Selling Climax, I expect it to clear liquidity at 1888 region before retesting and getting a leg up into the 2k region.
This call is rough a week or two. Plenty of RED ASS OBs waiting to get hit. Frankly, I see a short happening at 1950 but, I'm fairly confident of the lower R:R by pushing that to 1980ish. With Fib pulled over, 1980 is our favourite 0.618 region, if our signals indicate a strong sell and buyer momentum decline, we have ourselves a beautiful pristine, shiny, ornamental short.
Will update once I'm in. Limits won't be set yet.
Also, one reason why I don't expect a drop below 1888 is because of the chinese. We love the number 8. I'm fairly confident in my peoples nature to throw money at the number 8s of the world. Have a great night ladies and gents.

Gold is ready to tumble to $1,810 before the riseIf you haven't followed my analyses for the last 15 years.
You'll know, I am a BIG gold bull.
Yes I know gold hasn't performed as well as it did in the 50s, 60s, 90s etc...
But it's the tortoise of commodities with the algorithms, the exposure in longs and shorts and with the greater variety of safe-havens.
But Gold will eventually head up to $100,000 eventually.
It's a waiting game.
For traders however, there is a short opportunity for downside which looks juicy on the radar.
We see an Inv Cup and Handle on the daily. The price has broken below the brim level, and there is a current test on the resistance.
It could even break above the brim and head and test the downtrend line. But right now the opportunity is leaning more to a short and downside to come.
Other indicators confirm.
21>7
Price>200 (Price heading to this level)
RSI<50 and lower highs (Sell divergence).
My first target is down to $1,810 then we will re-evaluate the next opportunity.

hours and days to comeIn the coming hours or days, gold will move down after the pullback to the previous week's low and will break its last week's bottom to experience the low numbers again.

The Gold Odyssey - Here we go again!Someone mentioned to me that Gold is an asset that never loses money. I took the effort to show previously that Gold can very well do a 20% drop over a slow bleed (months) before it travels back up months later too. I also warned that Gold appears not to be able to keep properly and well above 2000-2080. Since 2020 (the Gold Odyssey series started in 2019), there is a multiyear consolidation range between 1650 to 2050, roughly.
Having pointed all that out, it appears that Gold had given up the cling to 2000. Here is why:
1. There are lower lows and lower highs (clearer in Daily chart);
2. a clear breakdown of small consolidation range at 1960 support;
3. Technical indicators MACD and VolDiv have crossed under their lagging signal lines; and
4. The TDST (Green dotted line) was broken out of and with long upper tailed candlesticks reversed back to break down of that TDST. When prices are above, the primary trend is bullish. Now it reverted back to a bearish primary trend. (This is part of TD Sequential rules).
Given the above, we can project that the most likely trajectory in the following months is down to 1680 (4Q2023), in a repeated pattern, for the third time, since 2020. There should be a stalling consolidation about 1800 too, so expect that.
Now, for this to happen, a few fundamental things need to align...
a. the USD should be rallying hard upwards;
b. the interest rates should be rising too;
c. inflation moderates; and
d. Possibly in alignment, can expect the equity markets to be bearish.
Heads up and take care!
ps. some dates projecting forward are marked. :)

Gold down to $1900-$1880 before take off to new ATHGold may fall down to $1880-1900 before resuming its uptrend and break new records to the upside. New ATHs are probable if this scenario play out.

Gold:the monetary commodity’s fate in the hands of central banksGold is arguably the most sensitive commodity to monetary policy. The metal operates more like a pseudo-currency than a regular commodity (a regular commodity’s price is driven by the balance of supply and demand, gold is driven by many of the macro determinants of currencies).
After hiking rates every meeting since February 2022, the Federal Reserve (Fed) took a pause in June 2023. The central bank has lifted the upper bound of Fed Fund target rates from 0.25% to 5.25% over that timeframe, marking one of the most rapid rate hiking cycles in history. At times, the Fed was hiking in 0.75% clips. Rising interest rates were an extreme headwind for gold for most of this period. Can gold investors breathe a sigh of relief now? Is this a temporary pause, or a halt on rate hikes? Well, if Fed Fund futures are to believed, there may be one more rate hike by September 2023. If the participants of the Federal Open Market Committee (FOMC) are to be believed, there could be several more rate hikes (with the median expectation of these participants pointing to a terminal midpoint rate of 5.625%, that is, an upper bound of 5.75%). Professional economists1 seem less sure of such decisive action, with the median looking for no change in rates this year (and cuts commencing in Q1 2024). Senior Economist to WisdomTree, Jeremy Siegel, believes the Fed is done hiking and that alternative inflation metrics, which incorporate real time housing inputs, show inflation running at 1.4% instead of the official 4.1% in May 20232.
Market inflation expectations are not falling away as fast as we would expect. Judging by the 5yr5yr swaps, longer-term market inflation expectations are actually rising modestly. Higher inflation tends to be gold-price supportive (other things being equal).
After hitting an all-time high in 2022, central bank demand for gold has maintained strong momentum. Official sector gold buying in Q1 2023 was the largest on record for the first quarter (albeit lower than Q3 2022 and Q4 2022). A YouGov poll, sponsored by the World Gold Council3 , showed that developing market central banks are expecting to increase their gold reserve holdings and decrease their US dollar reserve holdings.
With a lack of forceful stimulus from the Chinese government, and still elevated gold prices in Renminbi terms, we expect a slowing of retail demand in China. In fact, Shanghai premiums over the London Bullion Market Association (LBMA) price slowed in May and remain low in June.
Looking to WisdomTree’s gold price model, we can see that bond headwinds have clearly fallen away and US dollar depreciation (relative to a year ago) is offering gold some support rather than dragging prices lower. However, investor sentiment towards the metal has moderated since March 2023, when the collapse of Silicon Valley Bank (SVB) and the shotgun marriage between UBS and Credit Suisse Banks was announced. With the passing of the US debt ceiling debacle, there aren’t any specific risks driving gold demand higher. However, general recession fears and the potential for unspecified financial sector hiccups are likely to keep gold demand moderately high as the metal serves well as a strategic asset in times of uncertainty.
Source:
1 Bloomberg Survey of Professional Economists, June 2023.
2 The alternative measure calculates shelter inflation using Case Shiller Housing and Zillow rent which annualise at 0.5% instead of the 8% that is biasing the Bureau of Labor Statistics CPI higher.
3 2023 Central Bank Gold Reserves Survey, May 2023.

gold mcx dialy chart or spot looks like h&s pattern update belowyes eys on neckline 58350 spot 1918$ stya blw or close blw 2 days will show power 1880--1845$ in mcx 57278--56100+++++ yes more update it will completed or not stya tuned with us wia whtsup

yestrady gold silver sell gvn melted like ice enjoyeddyess today again ready for 6 om data after will see good move on chart stya tuned with us wia whtsup

Gold's Chart Signals Temporary Downtrend but Uptrend Indicators As per the analysis of the provided chart, the outlook for Gold suggests potential downside towards the levels of 59260 , 59000 , and 58700 . Traders should pay attention to the level of 59600 , as a crossover and close above this level could signal a resumption of the uptrend. The presence of the 100-day moving average and a parallel channel on the chart further support the notion of an underlying uptrend, indicating that the current downtrend may be temporary.
In terms of key events for today, the following are of significance:
18:00 Core PCE Price Index (MoM) (Apr) and Core Durable Goods Orders (MoM) (Apr) - High impact
19:30 Michigan Consumer Expectations & Sentiment (May) - Low impact
22:30 U.S. Baker Hughes Oil Rig Count - Medium impact
Additional information and important event details for the upcoming week will be provided shortly.
