GD1! trade ideas

Gold H4 Setting Up For A Test Of 2100In this update we review the recent price action in the #Gold futures contract and identify the next high probability trading opportunity and price objectives to target

GOLD Update (weekly chart)Do you see how well those Gann fans squared work? -- Gold consolidates at the Gann confluence and either flags to resume is present path along its Gann ray, or it puts in a reversal at the Gann confluence (the crisscrosses of the fan lines). It most often resumes its path along the fan rays.
I currently have two possible paths for gold.
The first possibility is a fallback from the current level to around 1951.5 on 8/23/23 (downward sloping red arrow). From there. I could see an upward resumption to 2035.5 by 12/26/23. I have two questions about this scenario:
1) Will gold this year follow its historical seasonal tendencies? I'm speaking of gold in US dollars. If gold follows its historical seasonality, it should sell off during the summer months. Historically (from 2004 to 2022) the percentage gold has closed higher each month is as follows: May (47%), June (42%), July (63%), August (63%), Sept (42%). The fourth quarter has historically been bullish for gold. Given this pattern, we would see a selloff around May and June.
2) Is there anything "normal" about this year? We have escalating financial banking stress, potential budget standoffs, geopolitical tensions, and geopolitical forex coalitions being formed. None of these augment well for stability.
The second possibility, shown by the upward sloping arrow, is that given current macro tensions, gold will continue its current path and reach 2237 by 12/26/23, and 2407 by 4/29/24. This scenario makes the most sense, from a macro event perspective, as well as the "geometric construct" of the chart -- the current trend should continue to follow along the current ray, which is also aligned to the purple colored Gartley 1.618 extension (which ends at 2407) which is drawn from a starting point of September 2018 (which coincidentally, happens to be the last belt tightening period of the FED).
The current point & figure objective is 2596 and is taken from the stockcharts.com P&F chart using a three box construct and based on ATR 14 (you should always use ATR on a P&F chart for commodities like gold).
I am in the camp for the second scenario, I believe gold should be around 2237 by year end and around 2407-2596 by April of 2024.

GOLDGOLD - Short
GOLD starting its downtrend
- Below marked pink areas are targets and reversal zones.
- Strict SL is given.
- Analysis done in 1h time frame

Gold on down impulsive wave or notGold on down impulsive wave very high volatility
support become resistance with
candle congestion act as resistance

GOLD FUTURES Stock Chart Fibonacci Analysis 042423Trading Idea
1) Find a FIBO slingshot
2) Check FIBO 61.80% level
3) Entry Point > 2002/61.80%

Gold Exiting Sage-1 Setup - Moving Into BreakawayHave you been following my research?
My research and application of Technical Analysis is different than most others. I use techniques that align price action with advanced Price Energy cycles/waves.
I still use traditional Technical Analysis - but my application of the data is vastly different than most others. I've been doing this for more than 25+ years.
I see only two opportunities for #Gold Buyers to take action below the HKEX:2000 price level - right now, and December 2023 ~ March 2024. After that, you won't see the $2k level again (possibly) until after 2035.
If you are a goldbug or invest, buy, or trade Gold - follow my research.
Watch how price plays out and aligns with my research. I may be off by a few weeks in some areas - but I believe this is the most logical long-term Gold forecast you will find anywhere on the planet.
Please post your comments and leave feedback.
Time to prepare for the biggest gold trade of your LIFE. It's setting up right now.

Gold resistance - testing back below 2klast week was the first weekly close below 2k in GC since the recent breakout. Weekly chart highlights the multi-year range, big question is whether sellers have enough to re-take control of near-term trends this week. I don't doubt that Gold can prod a lasting move above 2k, I just don't think that'll happen until the Fed pivots and I'm not expecting that while Core CPI > 5%.
Am tracking a series of resistance levels overhead, 2008 near-term, 2023 above that. 2037, 2049 above that
supports 1980, 1954 and then 1944
next week is FOMC and ECB

Gold is on down impulse wave or notFlat correction going to finish soon?
I hope 3th down wave is coming soon
also this point is support becomes resistance

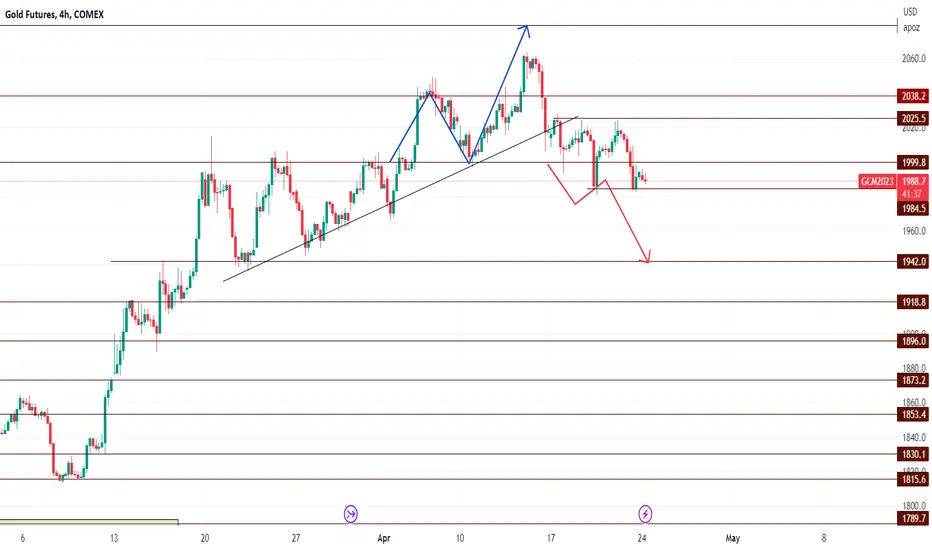
Gold strongly correlated to the DollarGold trades in consolidation between the 1985 and 2025 region throughout the week.
A breakout of the 2025 resistance region can push price towards 2080 while a breakout of the 1980 support region can push price towards the 1942.
Gold analysis - daily chart Slowly getting there
Monthly suggests moving higher to complete move up from 1999
Weekly while below 2078 could see a deeper correction before the next retest higher
Daily showing the first wave of a move higher so now we need to monitor the 2078 weekly high and possible topping pattern in daily to measure momentum.

Bias more on downside For Gold after hitting 2000+ resistance. 22th April
Gold - Support 1970/80
Break below 1970 = shall see 1920.
Immediate resistance - 2025

GCM3 High: 2060.00 Low: 1983.00 SidewaysWeekly Kickoff levels are longer timeframe levels where we believe longer time traders will adjust inventories.


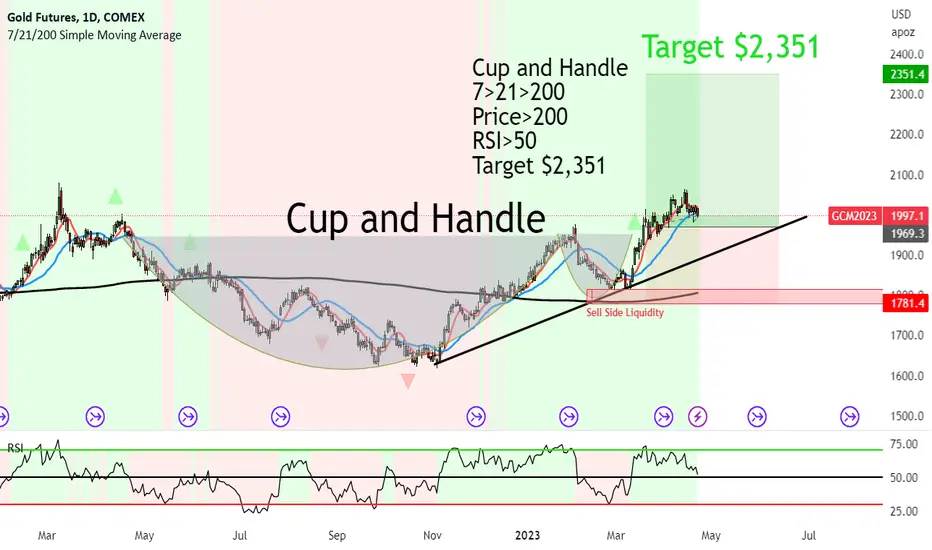
Gold still setting itself for upside to $2,351 with SMC ExplainCup and Handle formed on Gold recently.
We had a break above the brim level.
Now we are having some kind of retracement, for Smart Money to pick up orders before heading on up.
7>21>200
Price>200
RSI>50
Target HKEX:2 ,351
SMC:
Sell Side Liquidity order block is just below the handle of the C&H.
This is also where the powerful 200MA is.
When the price came down, Smart Money swept the liquidity of selling (bought into them) and hence the price shot up.
I am still very much bullish with Gold - Until further notice.
Gold 15 min TF forming a bull flagAfter a long upside run, gold is making a clean trend down with almost 4 touch points so far. A trend breaking to the upside could give a good RRR.

GC1!4.20.23 This is a follow-up gold chart from earlier today. I decided to post this because this is an example of how a higher time frame such as a 4-Hour chart can give you more immediate and more relevant information than a smaller time frame... which makes it much easier to trade.... and you don't really miss anything even though we used two bars on a 4-Hour chart. You could have been a seller or a buyer here today and made about HKEX:4 ,000 in either direction as long as you pick the right trade location... and you can use Gaps to do that.

Gold Daily Log Chartdistance from 50 day moving average
#Gold's distance from 50 day moving average review.
Keep in mind, corrections are a mixture of time and price.

Gold's Weekly Log ChartSo yeah, #gold is close to taking off...
Are you worried?
I'm not.
notes:
bullish consolidation above early breakout line
non reporting small speculator longs breaking out
net about to over take total shorts

Gold may not shine for 2 yearsGold is undergoing Elliot wave's 4 th wave consolidation
This will take equal time of 13 years of Mega 3rd wave rally.
GOLD may not shine during Stagflation Economy Cycle.
Smart investment in gold may be after it reaches $1045 again

Gold Ending diagonal?lower timeframe view. do we head a little more down until we continue the move up?

GC! | Informative| Gold 2023-24 Perspective | BullishCOMEX:GC1!
Possible Scenario: Long
Evidence: Macro Economy variables, including $DXY bearish price action, inflation, and recession outlook for following years, I expect at least a 50% price jump.

Gold4.18.23 Gold: In this video I was trying to review the price action of gold and how you can have a fairly predictive way of knowing where the market might go and what that means to buyers and sellers. this is not necessarily Your signal that you must trade your strategy or be a stop and reverse trader....It's a way of knowing when the market is likely to change direction at least for a while. It's something you might do to be more objective about the price action so that you can have A sense of when the Market's going to work for you or against you if you have a trade Position. This shows you potential reversals, But I would not Necessarily make a trade decision on every reversal. However, Since you're going to be trading for the next 10 to 30 years..... it may be worth your time to go through the exercise of looking at this because it may be much more objective than arbitrary internal monologues...ie. your internal thoughts over greed and fear as opposed to with the chart is telling you.
