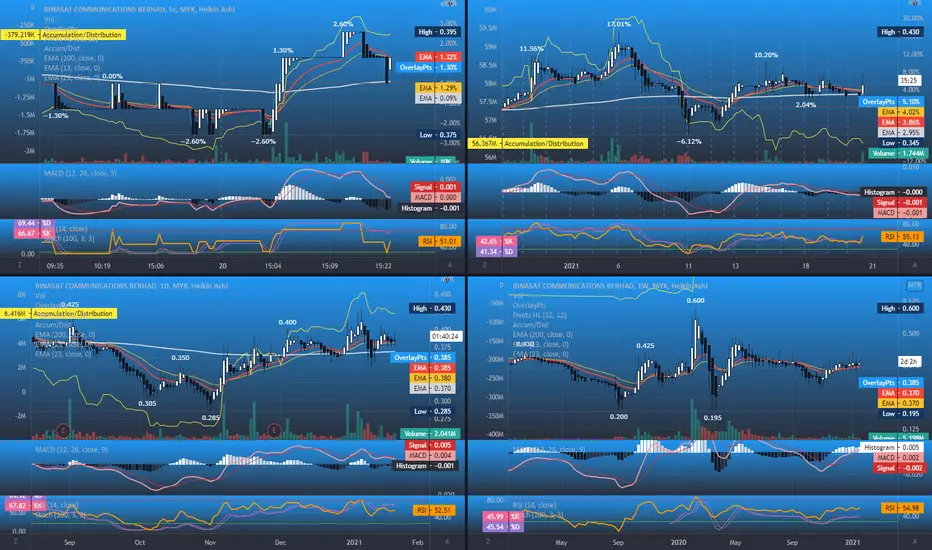
BINACOM IBULLISH ABCD HARMONIC PATTERNWave XA retracement to B (0.350) is in-between fib618-786 levels and the rebound failed to cross fib382 (0.400) thereby retracing to 0.280 (also the 52wl) to double-bottom and forming an AB=CD bullish harmonic pattern. To enter trade, the probable EP would be 0.290 to retest a demand zone and the probable TPs are 0.325 (daily pivot point), 0.365 (fib618, R1 and also yearly resistance), 0.400 on touch-point (fib382 and above 0.395 yearly resistance). The probable CL would be at 0.250, ie, below S1.
BINACOM trade ideas

BinacomThere is a possibility of double bottom pattern and if that happens then we might see a bullish break out. Please comment on what you guys think of this. Thanks.

BINACOM AnalysisDisclaimer: This is not a buy call but for learning purpose
Technical Analysis
Price between MA20 & MA50
Volume OK
Potential rebound at MA line
RSI around 50


wait firstweekly chart is up trending but stochastic not looking very good
daily chart stochastic is at oversold region, not yet crossing
may be some price rejection will occur first
wait for signal from weekly chart

BINACOM: RETRACE OR MOVING UP?Binacom is in strong bullish mode.
Will, it let the bull keep running or push down by the bear?
IF the momentum maintains, expected to reach the 0.60 prices.
Note: Just a trading idea. NOT a buy call

BINACOM - Bullish BreakoutBINACOM
Theme: 5G Infrastructure
Rst: 0.47
Spp: 0.43
Marubozu candle, pushed BB substantially wider with increasing volume, this is powerful breakout and the momentum will last another few weeks.


Break out BInacom (0195) - Telecommunications & Media- Ace Market
Binacom breakout resistance on horizontal line on 09/02/21 with huge volume,
Cautios due to presenting of long upper tail ,
classified Uptrend counter when price above MA200,
Pull back T1 - T2 with low volume,
52 wk price play around 0.195 to 0.565,
MACD cross up signal line at strong buy area,
Stoch TF30 mins is oversold area,
RSI above 50,
Gann Square Chart - SnR - 0.40 & 0.43
This is study purpose only not a buy call
TAYOR- Trade at your own risk
Without strategy, execution is aimless

new adventure stock BInacom Uptrend
slow turtle
fast turle
fift positive
HH and LH
buy 40% at 0.44
buy DIP 30% at 0.41 to 0.435
buy at support 30% RM 0.375
TP 0.475 , 0.560
SL below 0.34

Who dares to bet against Binacom breakout next week?Binacom is on a bullish mode. Expect the price to break the triangle pattern soon.

BINACOM Spring CompletedAccumulation phase.
1. Spring completed with noticeably diminished volume.
2. Price cross up EMA20 and EMA100.
3. Stoch oversold.
1st Target will be 37%
2nd Target will be determined once the price makes an LPS.

time to rallykeep my own record...
from the chart VS volume correlation, going to break the resistance.
not a buy/sell call

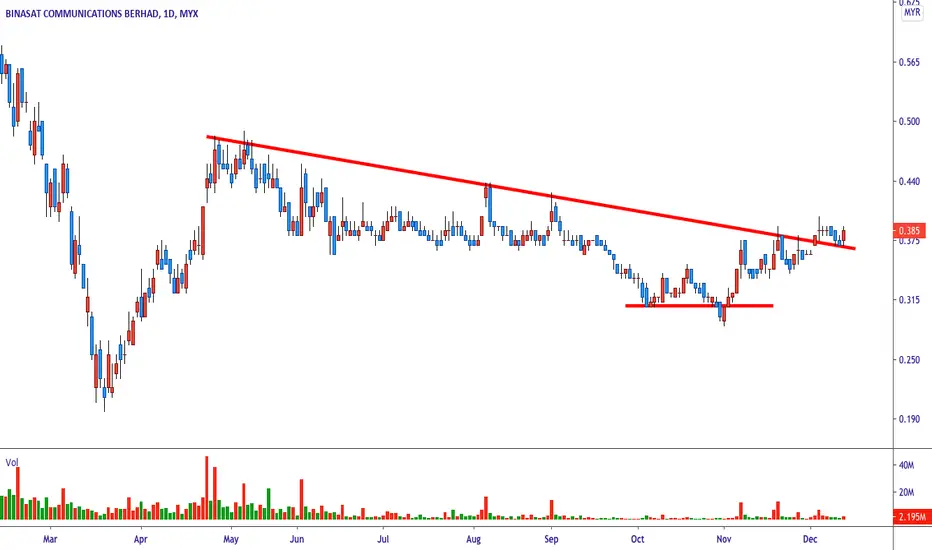
BINACOM [2 December 2020] Buy On Resistant Zone Break OutMYX:BINACOM
SWING: 2 DAYS TO 2 WEEKS
Breakout Downtrend Line
52 Weeks High Line
Fibbonaci Retracement
Candlestick Support & Resistant Zone
Trendline Support & Resistant


BINACOM - bullish momentum?Weekly timeframe menunjukan ada bullish engulfing. Dijangka akan meneruskan kenaikan ke harga 0.390 as per Fibonacci ratio.
#Idea
#SekadarKajian
#BukanBuycall

Binacom Nak keluar dari downtrend??Breakout pattern
Stoch cross dekat oversold
RSI masih bawa 50
Jika berjaya tahan di paras 0.315, boleh menuju ke atas.
***hanya untuk kajian. bukan buycall

BINASAT COMUNICATION 3M SETUP PRICE MONITORINGSTOCH RSI FACING UP, 3M SETUP, CANDLE BREAK UPPER TREND LINE, NEAREST SUPPORT IS STRONG. PRICE IS POSSIBLE TO GO HIGHER IF BREAK THE NEAREST RESISTANCE. SUITABLE FOR MID TERM AND LONG TERM SWING.

BINACOM clearing the seller before buyer take overAfter few weeks accumulate the price in the trading range.. with a small spring formed in the previous week.
Looking for buying sweet spot target TP1 on the trading range resistance before a move to TP2 and TP3.

