DESTINI dah breakoutPada 25.03.2022 Destini dah breakout support 0.185
EP: 0.190
SL: 0.230
TP: 0.175
DESTINI trade ideas

Destini is destine to be long laterBased on analysis conducted, Destini is currently minor bullish before going down, where it will go up as per arrow completing the Z wave. And down for another correction before a long and more profit.
Each of turn is the target price for correction and impulse.
How to know? Hint: To count bar by bar, then you will know.

BURSA : DESTINI (25/09/2021)TP = as per TP01 Line
Support = as per Support Line
Stop Loss = as per Stop Loss Line

DESTINI FORMING IHNS?Destini on weekly timeframe already Break out its weekly downtrend line.
Will it going to form inverted head and shoulder pattern? lets wat and see RM0.350 coming?

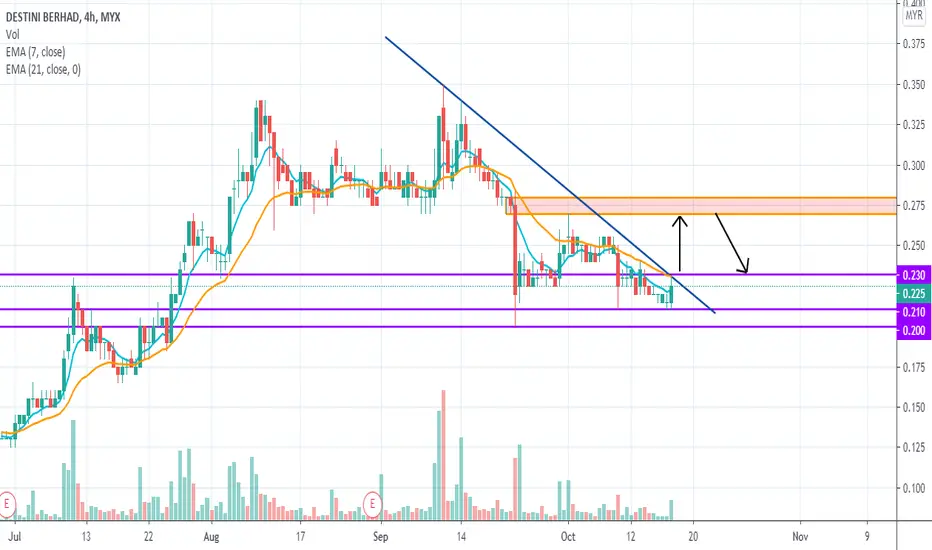
DESTINI - a genuine Down Trendline tester?1) Break Down Trendline and seems tested it again.
2) Price above purple line - good sign
3) Still in cycle. SL at 0.245. Big buy volume to test 0.28, if breaks, then its good sign of break out.
TAYOR

A New Highest Price!DESTINI set a new highest 52 weeks price with the continuous volume set above MA20. MACD and OBV charts are still in an uptrend pattern. To place a bid, use VWAP as a guideline to identity the price bid. Place your bid price below the VWAP line.
R 0.320
S 0.280

Destini 06/09/2021Destini 06/09/2021
Whale movement detected ready to Pump . slowly turn down, but still have the momentum to push.
Money Flow smoothly show increasing of accumulation from market maker
Accumulation phase regain momentum for another Spike to happen in next few days.

Destini day chart 1/9/21Go long
-above 100ema
-price traded above Kumo
- senkou spans rise at angle 45 degree and merged.
-tenkan n kijun too
-breakout from falling wedge pattern ( not drawn)
- DMI and RSI showing good momentum and RSI will remain in the overbought region for quite sometimes if momentum is strong.
- f.float 36.6%
in short LWTG!

DESTINI TO AWANBIRU (TWIN STOCK)Watchout if price BO and closed above trendline (yellow line).
Bearish Trend will continue if price below red line (Major Support).
#TAYOR MYX:DESTINI MYX:AWANTEC
#PRIMEMINISTER9

DESTINI CLIMBING & GAP UPMy Prediction using method Elliot Wave + Fibonacci Extension + Technique Formula Close Gap


DESTINI looking to continue uptrendDESTINI already break the all-time down trendline on 20 Jul 2021.
The price already has pulled back and tested the down trendline.
The price is looking good to rebound at an uptrend trendline.
Stoc RSI weekly just crossed up, potential to go up.
The best entry for today is above 0.265.
(Just for research & learning)

DESTINI - ideas updateNote
- Base on Trendband chart, the price of this stock are undergo for correction.
- Suggest entry should be after breakout or in between 0.22 and 0.18

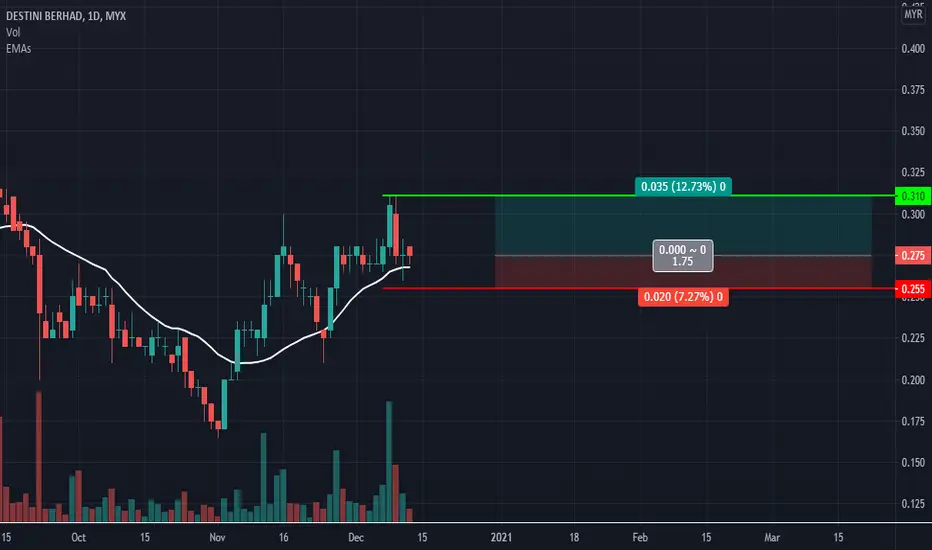
DESTINI AnalysisDisclaimer: This is not a buy call but for learning purpose
Technical analysis
In accumulation phase
Price at MA20 line
Volume is OK - 3 buy volume spike in Nov
Potential uptrend continuation
Trading idea
Entry price: 0.260-0.275
Cut loss: 0.255
TP1: 0.310
TP2: 0.340
TP3: 0.370

DESTINI: Could it finally closed the 2 years gap?A good volume followed by good bullish candle, if no heavy profit taking for the next few days, could it potentially close the 2 years gap? But it need to break 0.350 first. Exciting!


Destini - DowntrendStill downtrend... next support at 0.215,
EP 0.215....
if support break... the support is 0.165
Good EP = 0.17-0.2
Worse case drop to base support at 0.13 if 0.165 support break
carefully trading... buy when oversold

Destini - what is the next??Today closing = the low at the last 2 bar...
50/50
doji also 50:50
if dragonfly doji can reenter
wait and see tomorrow


will destiny breakout and fly???buying Volume keep increasing day by day... target min 0.28 but it can fly more than 0.3

Destini comeback...High volume enter at 0.28, now rebound after fibonacci correction A-B-C...first wave target min 0.28... insyallah..longterm TP > 0.3

DESTINI: STILL DOWNTREND AND POSSIBLE SHORT TERM TRADING ONLYDESTINI POSSIBLE BREAKOUT TO TEST 0.270-0.280 BEFORE FALL BACK TO DEMAND ZONE. STOPLOSS @ 0.200. MY VIEW ON MIDTERM, BEARISH PRESSURE STILL THERE AND I DONT THINK IT WILL BREAKOUT TO BREAK THE DOWNTREND CYCLE AND BECOME UPTREND.
TAYOR!