CORAK SYMMETRICALCoretan Trading Idea ini hanyalah kajian & pembelajaran sesuatu kaunter saham SAHAJA. Ini BUKAN merupakan satu bentuk BUY CALL kepada mana - mana pihak dari penulis.
Mana - mana pelabur dan pedagang adalah bertanggungjawab terhadap tindakan dan pelaburan masing - masing.
BERDAGANG DI ATAS RISIKO ANDA SENDIRI
SERSOL trade ideas

SERSOL DESCENDING TRIANGLEThe descending triangle is recognized primarily in downtrends and is often thought of as a bearish signal.
It can form as a reversal pattern to an uptrend if BO above triangle line, but mostly seen as bearish continuation patterns.
#TAYOR MYX:SERSOL

BURSA:SERSOL 29/09/2021TP = as per TP01 Line
Support = as per Support Line
Stop Loss = as per Stop Loss Line

SERSOL Trend Continuation1. Uptrend market structure
2. Possible pullback at Fibo retracement 0.5~0.618.
3. Stochastic oversold
1st TP is 68%
2nd TP is 112%
Cutloss is 37%


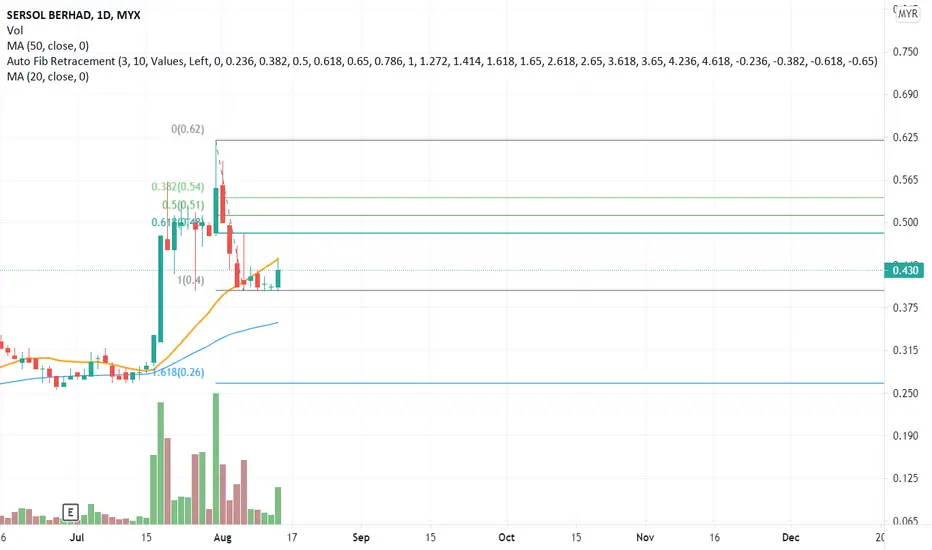
A Down Trend Pattern!Using Fibonacci (FIBO) chart. SERSOL is in a Down Trend Pattern. The trend was also confirmed by using MACD and OBV. Based on the previous history, high possibility SERSOL will bounce back when it hit FIBO lowest retracement levels at 0.400.
R 0.440
S 0.400

SERSOLThis stock with momentum is generated using a FIFO B signal with a build-up in trading volume and price.
This is not a buy or sell recommendation. It merely tells you which this stock is seeing higher potential to move uptrend with relatively strong momentum.
The share price may move up or down from this point. Note also that momentum generally only persists for a short period of time.
However, this stock has an accompanying fundamental score and valuation score to help readers evaluate the attractiveness of the stocks if they want to ride the momentum.

SerSol Where it will Go? Now in Wave 4Just be patience Resistance @ Fib 0.5-0.618
ACE: Chemical
Company operates through two segments: Malaysia and Thailand. The Malaysia segment consists of the manufacture and sale of coatings, thinners and industrial chemical. It is engaged in investment holding and provision of management services, and trading of architectural coating and wall surface finishing materials. The Thailand segment is engaged in the manufacture and sale of coatings, thinners and industrial chemical. The Company's subsidiaries include Multi Square Sdn. Bhd., which is engaged in the manufacture and sale of paints, chemical solvent, industrial chemicals, aluminum and metal products; Sersol Coatings Sdn. Bhd., which is involved in the distribution of coating paints, and Multi Square Coating (Thailand) Co Ltd, which manufactures and sells coatings, thinners and industrial chemicals.

Price Push up from bottom FIBOwww.tradingview.com
SERSOL gain price momentum from an earlier sideway trade. Resistance 0.485
How to use multiple timeframe for entry1. Main TF is Daily TF
2. Entry TF is 15Min
3. Change 15Min to Heiken Ashi for a smoother plot easier to identify the market structure.
4. 15Min break market structure is the signal to go long.

SERSOL TF(4H) WAVE 4 IN PROGRESSW1 = DONE
W2 = DONE
W3 = DONE
W4 = In progress
Invalidation buy if price cross down 0.325
Disclaimer: The idea is for educational purpose only. Trade at your own risk.

HIT TP! SERSOL - Volume Profile AnalysisSERSOL hit target price @ 0.395
New long position (if any) has to be carried out cautiously
Please refer to my initial post on 14 July 2021

SERSOL - Volume Profile Analysis!! For Educational Purposes Only !!
RBS @ 0.275 area
!! This is not buy call !!
#TAYOR

SERSOL is coming back???Today, EPRAF shows that the green line tends to cross the red line. In the EPRAF indicator, this is a good sign for a new phase of the uptrend. By crossing the new MACD and the stochastic level above 60, SERSOL will give us a “lemang” soon.


SERSOL: REVERSAL AND READY TO DEPARTSERSOL had form support around 0.235 for almost 7 trading days. Support firm and stoch RSI had break up to 20. Looking forward to challenge RM0.28 and follow by RM0.31 in 1 month timeframe

SERSOL - ideas update_ In my previous watch, seems this counter show some potential to growth in second.

Sersol multiple breakout attemptsSersol can be seen trying to break the resistance at 29 cents over the past few days. Accompanied with higher volume but it still closed at 29 cents. As long as it does not break that blue uptrend line below, this counter should still remain bulish. Let's see if Sersol manage to break and close above the 29 cents resistance in the coming week.
Dislaimer:
This is by no means a recommendation to buy. The ideas shared here are mainly for educational purpose only. Please consult your financial advisor prior to any investment decision.

SERSOL AnalysisDisclaimer: This is not a buy call but for learning purpose
Technical analysis
Volume OK
Price around minor support and major trendline.


SERSOL - ideas updateNote
_There is some potential counter on my screener. Look for best entry/exit. Suggestion are on the chart

<TradeVSA> Stock Review & Update - 15 March 20211. Dnex
2. MSM
3. GFM
4. Itronic
5. MHB
6. Encorp
7. Mmccorp
8. Thheavy
9. KPS
10. Media
11. MNRB
12. SPSETIA
13. Armada
14. UEMS
15. Edgenta
16. Econpile
17. AirAsia
18. Eco World
19. Mitra
20. Dataprep
21. Sersol
22. Priva
Hit the "LIKE" button to support us :)
Disclaimer
This information only serves as reference information and does not constitute a buy or sell call. Conduct your own research and assessment before deciding to buy or sell any stock

SERSOL - Symmetrical TriangleSERSOL just recently breakout symmetrical triangle with high volume
My target price will be around 0.345
