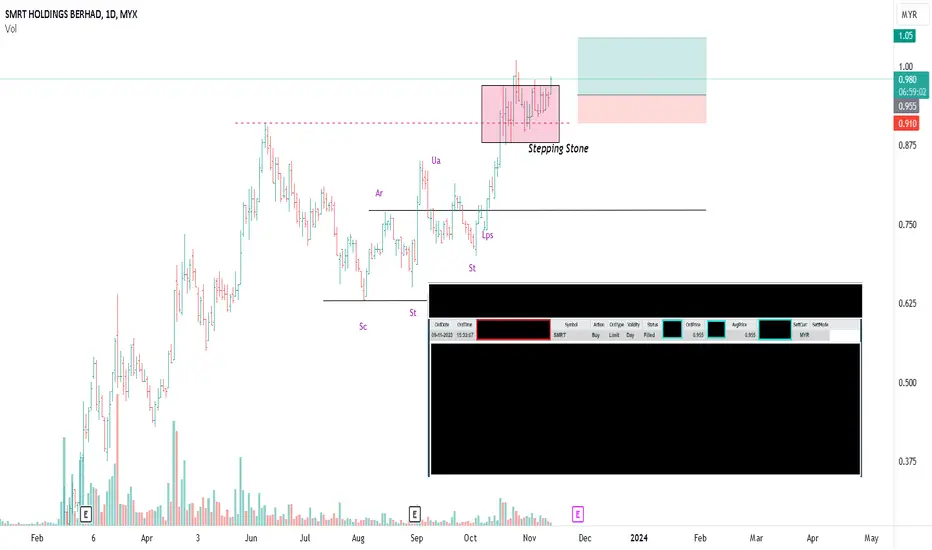
SMRT GOING TO MARK UPThis is a pov from Pure Wyckoffian perspective
Few points why i am interested with this stock to trade :
1/ The line yellow marks the transition of from non trending to Trending environment
in which wyckoffian term as Change Of Character (ChoCh)
2/ The zone of contraction , in which David We
Next report date
—
Report period
—
EPS estimate
—
Revenue estimate
—
0.06MYR
26.69 MMYR
69.09 MMYR
388.92 M
About SMRT HOLDINGS BERHAD
Sector
CEO
Maha Ramanathan Palan
Website
Headquarters
Cyberjaya
Founded
2004
ISIN
MYQ0117OO000
FIGI
BBG000BYQV32
SMRT Holdings Bhd.is an investment holding company, which engages in the provision of talent development, education, and technology services. It operates through the following segments: Education, Training, Technology, and Investment Holding and Others. The Education segment includes educational institutions and educational management services. The Training segment comprises of human resources development training, consulting, outsourcing, events, learning resources and advisory support services. The Technology segment offers software consultancy and development and its related services. The Investment Holding and Others segment represents non-reportable segments. The company was founded on July 14, 2004 and is headquartered in Cyberjaya, Malaysia.


SMRT, is it smart enough?
After the price broke our short-term downward trendline, it making a new Higher High and Higher Low. This is the third opportunity to entry for this stock at nearest demand zone with stop lost below our zone. Expecting the price to make a new higher high around resistance 3 level.
This message

SMRT TF 1WSMRT Time Frame Weekly
Finding nice pattern = Flag pattern
Already break downtrend channel
Wait going to higher and wait to break another RESISTANCE
When break the resistance going to fly and price to ATH
#thisonlyforpredectionstudy
#thisnotforbuycallorbuysell
#chartpattern
#TAYOR
#MFM.TRADER

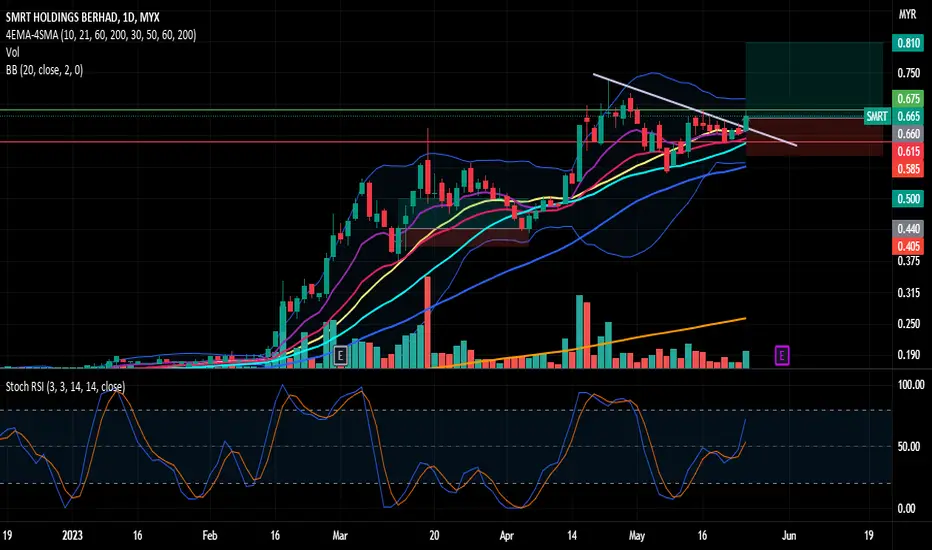
SMRT: Buy or Wait for Confirmation? Based on the chart, the price break MA20 with large volume. We can see that, the price still maintain above 0.57 and MA30 which can consider a technical chart. Now waiting the price to break the resistance 0.675. Moreover, the weekly chart shows that SMRT still in oversold region and likely to cross


SMRT - ideas update!Note
- From the trendband chart, it shows that the price action is in bullishness mode. I jotted down some ideas on pattern appear on these trend.
- the peak_R-01 lines show a constant rally of price movement from 0.14 to 0.155 which is giving us a good sign of the trend should go on bullishness.


See all ideas
An aggregate view of professional's ratings.
Displays a symbol's price movements over previous years to identify recurring trends.
Frequently Asked Questions
The current price of SMRT is 1.15 MYR — it has increased by 0.88% in the past 24 hours. Watch SMRT HOLDINGS BERHAD stock price performance more closely on the chart.
Depending on the exchange, the stock ticker may vary. For instance, on MYX exchange SMRT HOLDINGS BERHAD stocks are traded under the ticker SMRT.
SMRT stock has risen by 4.55% compared to the previous week, the month change is a 1.77% rise, over the last year SMRT HOLDINGS BERHAD has showed a 17.35% increase.
We've gathered analysts' opinions on SMRT HOLDINGS BERHAD future price: according to them, SMRT price has a max estimate of 2.28 MYR and a min estimate of 2.28 MYR. Watch SMRT chart and read a more detailed SMRT HOLDINGS BERHAD stock forecast: see what analysts think of SMRT HOLDINGS BERHAD and suggest that you do with its stocks.
SMRT reached its all-time high on Jul 29, 2024 with the price of 1.40 MYR, and its all-time low was 0.02 MYR and was reached on Mar 19, 2020. View more price dynamics on SMRT chart.
See other stocks reaching their highest and lowest prices.
See other stocks reaching their highest and lowest prices.
SMRT stock is 3.51% volatile and has beta coefficient of 1.03. Track SMRT HOLDINGS BERHAD stock price on the chart and check out the list of the most volatile stocks — is SMRT HOLDINGS BERHAD there?
Today SMRT HOLDINGS BERHAD has the market capitalization of 520.90 M, it has increased by 0.93% over the last week.
Yes, you can track SMRT HOLDINGS BERHAD financials in yearly and quarterly reports right on TradingView.
SMRT HOLDINGS BERHAD is going to release the next earnings report on Nov 27, 2024. Keep track of upcoming events with our Earnings Calendar.
SMRT net income for the last quarter is 6.22 M MYR, while the quarter before that showed 6.86 M MYR of net income which accounts for −9.39% change. Track more SMRT HOLDINGS BERHAD financial stats to get the full picture.
No, SMRT doesn't pay any dividends to its shareholders. But don't worry, we've prepared a list of high-dividend stocks for you.
EBITDA measures a company's operating performance, its growth signifies an improvement in the efficiency of a company. SMRT HOLDINGS BERHAD EBITDA is 28.21 M MYR, and current EBITDA margin is 41.31%. See more stats in SMRT HOLDINGS BERHAD financial statements.
Like other stocks, SMRT shares are traded on stock exchanges, e.g. Nasdaq, Nyse, Euronext, and the easiest way to buy them is through an online stock broker. To do this, you need to open an account and follow a broker's procedures, then start trading. You can trade SMRT HOLDINGS BERHAD stock right from TradingView charts — choose your broker and connect to your account.
Investing in stocks requires a comprehensive research: you should carefully study all the available data, e.g. company's financials, related news, and its technical analysis. So SMRT HOLDINGS BERHAD technincal analysis shows the strong buy rating today, and its 1 week rating is buy. Since market conditions are prone to changes, it's worth looking a bit further into the future — according to the 1 month rating SMRT HOLDINGS BERHAD stock shows the buy signal. See more of SMRT HOLDINGS BERHAD technicals for a more comprehensive analysis.
If you're still not sure, try looking for inspiration in our curated watchlists.
If you're still not sure, try looking for inspiration in our curated watchlists.