TOPGLOV trade ideas

TopGlove Inverse Head and Shoulder ? TOPGLOVE Daily.
TopGlov is obviously move slower as compared to Supermx.
However, TopGlove also just breaking out from Inverse Head and Shoulder pattern with SLOW TURTLE BUY and STRONG VOLUME.
Last 2 RED candles are with relatively lower volume indicating a healthy small pullback.
No Fast Turtle Sell signal be seen so far.
FiFT+ve, ATOM remain as BUY and Banker's Chip above 50%.
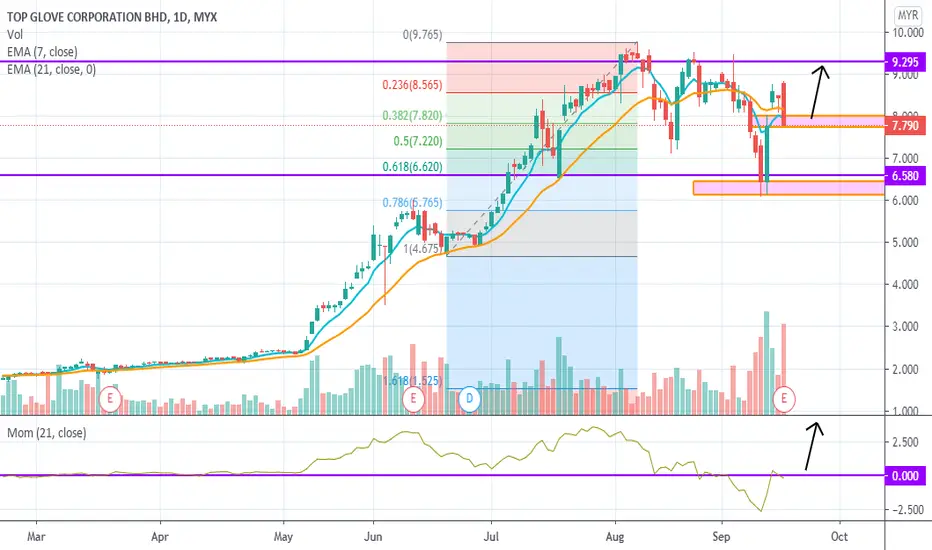
Fibo projection 1.618 is around 12 (Round number) and confluence to Heand and Shoulder target measurement...
Fast Turtle sell is below 9.2


{SWC}—— TopGlove Analysis, Pending for actionBias: Neutral
Topglove is still challenging the downtrend line with share consolidation, pending for direction. If is successfully breakout, it will challenge the neckline of RM9.00.
Resistance: 9.00, 9.40
Support: 8. 80, 8.50
Do remember there is some political issue tomorrow.
If you find this idea helpful, kindly leave us a like and comment!


{SWC}—— TopGlove, Bullish MomentumBias: Bullish .
Topglove had broken out short term down trend line, presented a tweezer bottom, bullish engulfing formation and continued its momentum. This shows a trend reversal signal.
Momentum Chips (red chips) show a positive signal.
Resistance: 8.80, 9.00
Support: 8.40, 8.00
Do remember the quarterly report will be announced on 17 September 2020.
If you find this idea helpful, kindly leave us a like and comment!

TopGlove - Ready to break ? Fast Turtle Buy and Bounce from EMA20 with higher Volume (But volume still below Average)
FiFT +ve
MCDX+ Banker's Bar increase and crosses above Banker's Moving Average.
Second ATOM Buy
TopGlov need to break above trendline and preferably stay above psychological resistance at 9
Continue to hold
SL 8.2, 7.4 depend on individual risk appetite

TOPGLOV [7 October 2020] Buy On Resistant Zone Break OutMYX:TOPGLOV
Breakout Downtrend Line
52 Weeks High Line
Fibbonaci Retracement
Candlestick Support & Resistant Zone
Trendline Support & Resistant


Will it breakout?Topglov has needs a solid break above the red line before it can try for the next resistance.


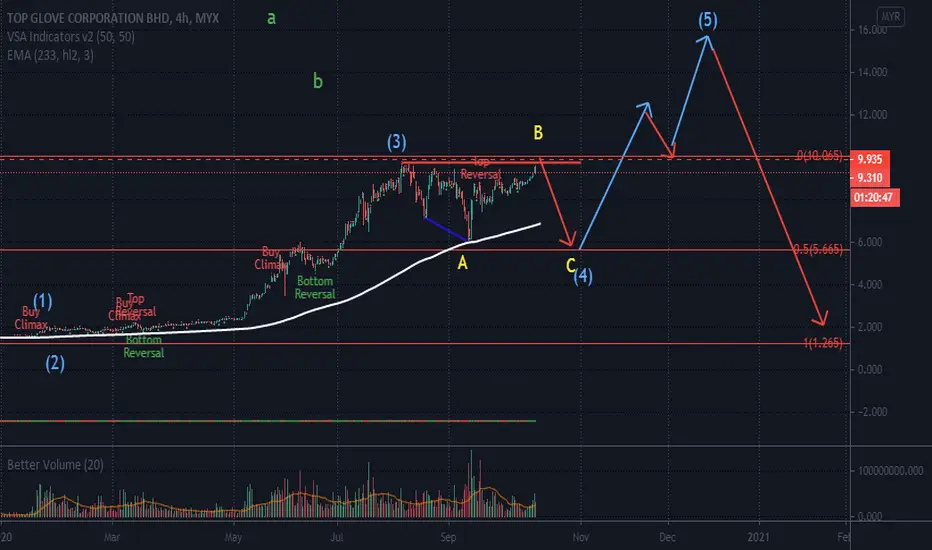
Top Glove - Wave B in the makingWave B of corrective wave.
Temporary bull.
TP area in the square box.


TOPGLOVE [S] 19/9/20 : Berehat sebentar1. TOPGLOVE berhenti di EMA50
2. Menghasilkan candle bearish engulfing, diikuti dengan candle hijau yang kecil
3. Seterusnya adakah akan melakukan kenaikan/penurunan?
Nantikan
Disclaimer: Hanya kajian buat pembelajaran. Sila like dan share
"Right place, right vision, right action"


TOPGLOVE: CLOSE THE GAP BEFORE MOVING HIGHER?LET'S THE CHART SPEAK!. IT WAS A HEALTHY RETRACED TO CLOSE THE GAP. MOMENTUM IS EXPECTING TO BE POSITIVE IN THE NEXT COMING DAYS!. BASED ON FIBO RATIO 1:1, MIDTERM TP SHOULD REACH 11.320 IN THE NEXT COMING MONTHS.
P/S: This is my personal view based on technical. Not a buy call signal. Trade at your own risk.