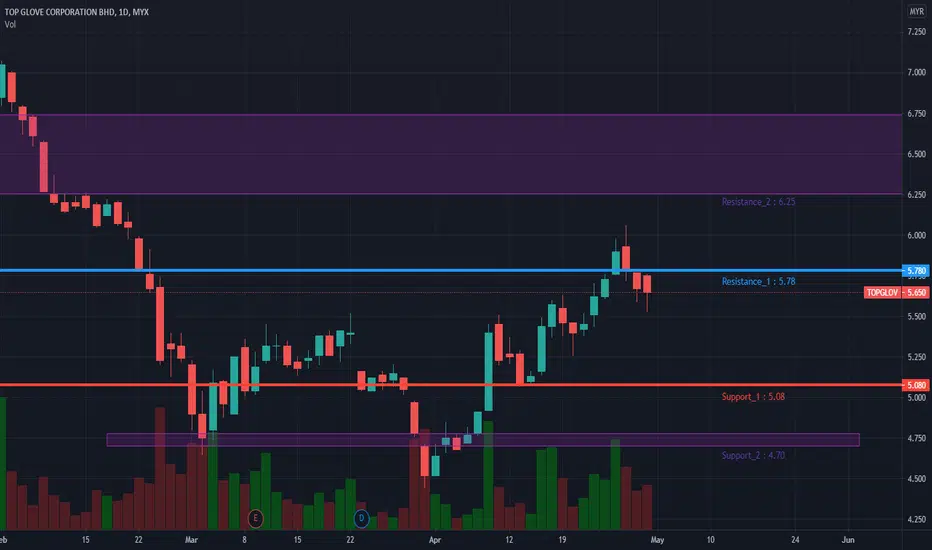
Expectation Record Top Glove for 03 - 07 May 2021Resistance 2 : 6.25
Resistance 1 : 5.78
Support 1 : 5.08
Support 2 : 4.70
TOPGLOV trade ideas
BVA.SGX_Breakout Trade_LongENTRY: 1.80
SL: 1.70
TP: 1.94-2.04
- ADX<25. Around 23.
- RSI<65. Above 50 so uptrend still intact.
- RS -ve
- FFI +ve
- Daily MACD +ve

<TradeVSA> Weakness in Top Glove? Exit or Hold ?Sign of Strength and Weakness in the chart:
Hourly Chart
1. UT high volume follow by Red Pentagon
2. Spring as support with price in 20/40ma
Take note on the next Green Pentagon and CoC for Pullback Entry
Disclaimer
This information only serves as reference information and does not constitute a buy or sell call. Conduct your own research and assessment before deciding to buy or sell any stock

<TradeVSA> Pullback Completed in Prolexus. Similar like Gloves ?Sign of strength in the chart:
1. Trend reversal with high volume
2. Pullback with Green Pentagon in hourly chart
3. Low volume near support level
Disclaimer
This information only serves as reference information and does not constitute a buy or sell call. Conduct your own research and assessment before deciding to buy or sell any stock

TOPGLOV : the return of bulls ? (Trend analysis)While TOPGLOV appears to be in a downtrend since October 2020, recent rebound raises a lot of questions whether the rally would sustain. A few things we've noticed here on the chart which are:
- A tentative downtrendline has been broken
- Positive divergence in RSI
- An inverted H&S pattern (however, rally volume seems diminishing after breaking the neckline)
- Price broke and stays above MA 50
- MA cross appears overstretched and still in sell mode
- Nearest support at neckline area around RM5.40
- Nearest resistance at RM6.00
From our analysis, we are cautiously bullish on TOPGLOV at least in the short term. To increase the bullish bias, we would like to see a break above RM7.00 level which is the MA 200 and a previously consolidation area which might prove to be a difficult resistance to break. A breakdown below March's 2021 low at RM4.45 however would change our view

FA or TA PROS:
- Best FA among rubber glove companies
- Glove demand growth: New waves of Covid infections loom globally
CONS:
- Vaccination rollout
- Competition from China: Government incentive+advanced technology+cheap cost+ramping up production
- Oversupply risk: New gloves players
- Labor allegation/US banned and etc
***TA always win shoooo ignore the above
1)Guppy's Rainbow
Guppy's Rainbow showed bearish trend as the candle stick is still below the white line (LT) and blue line (MT)
Long Entry would be triggered once all short-term EMA’s above the long-term EMA’s.
Trading Rules:
Long Trade: RED > YELLOW > Blue > White
Short Trade: White > Blue > Yellow > Red
Once it breaks the BLUE EMA'S might be a good sign
2) Pivot Points Smart Money Indicator
Green=Retailers
Yellow=Floating positon
Red tiang=Smart Money=Big positions, which always tend to impact price movement.
At the moment, no buyer's momentum detected yet which is not favorable.
PS: Small-cap glove stocks delivered even better share price gains with better TA ie: Comfort Gloves

TOPGLOV : One last rideTOPGLOV is seen to undergoing a corrective phase of wave 4 after an explosive move of a very long extension in wave 3. The fact that wave 3 has been so powerful and very extended, we would take a conservative view that the next coming Wave 5 might be truncated and not be able to break its previous all time high. Our view might change if it turns out otherwise. The bullrun in TOPGLOV in our opinion is past its youth and nearing its peak. We stand with a cautiously bullish view on TOPGLOV long term wise.

TOPGLOV : the return of bulls ? (Wave analysis)We are in a view that the correction in TOPGLOV has come to an end after it completed a zig zag corrective pattern on early of April while recent movement is suggestive that TOPGLOV is trying to form a leading diagonal form of wave (i) which in most cases will result in a throw over followed by a sharp and deep pullback in wave (ii). Nearest support seen is around RM5 area followed by RM4.65 area. We would however wait abit more to confirm the accuracy of our wave analysis. If our analysis is correct though, we might see the start of a new fresh bull market (Wave 5)

Top Glove Support & Resistance Personally, what I learnt is there must be a Technical Analysis Strategic Plan in order to increase the risk-to-ratios favourable risks.
1. Draw Support & Resistance
2. Identify the stages (Accumulation, Advancing, Distribution, Declining)
3. Entry Triggers
4. Stop Loss
5. Exits
I have learnt during my past mistakes that we should let the stock price comes to us, rather than us chasing the stock prices!

TopGlove + Supermx = brothers?Same as Supermx, many analysis both counters are undervalue by the price.
Glove demand is strong and high, APS is stable with very much above cost.
TG applying for dual listing in HKEX, EPS will dilute, but capital comes in wo!
Again RSS, investors or retailers who benefit most?
Idea is for sharing and education purposes, not for buy or sell call and by own risk!

Top Glove - Rising Wedge (Bearish)Top Glove is facing strong resistance at the 50% fibo level.
Rising narrowing wedge forming and nearing the tip. Volume is also decreasing. If break below trendline, expect a major selldown and breakdown to RM3.50 (23.6% fibonacci level). This is also JP Morgan's target price.


TOPGlov price last swing low was forming a wedge and three driveTOPGLOVE last swing low forming a three drive and price have broken the upper line of wedge pattern as detail on the chart.. If Price didn't break new high by end of the year and ranging, there is a possibility to form a triangle pattern..

EASY123 Prediction @MYX TOPGLOVEINI KALI KE?
Prediction: Bottom Reversal (MACD divergence versus Price action) Rally when it stands above 5.52
Target Price: R1=5.80-6.00, R2=6.50-6.80, R3=7.10-7.70
Support/Cut Loss: S1=4.45
Signals:
*Candle has turned from Red to Blue color on 15-Apr, an indication of a trend reversal.
*Price comes to the Bull/Bear Divider (Redline) to test the resistance.
*Green-upward triangle appeared on 31-Marn, an indication of potential Bottom.
*Yellow-diamond appeared on 01-Apr, an indication of a potential Bottom reversal.
*Disclaimer: This is not a Buy or Sell suggestion but solely sharing the information...Trade at your own risk.
*Preference Strategy: Swing trading (Follow the BUY/SELL Signal respectively).
*Reminder TP & CL is an individual preference & decision. No fixed rule or guideline for it.
Signal's Interpretation:
ENTRY Signal:-
*BT-Yellow-Diamond = Bottom reversal signal.
*Green-Upward-Triangle = Potentially a Bottom signal.
*Green-Dot = U-Turn entry point signal.
*Blue-Candle = Market at Uptrend sentiment.
*Candle color changed from RED to BLUE & Candle closed "ABOVE" the Bull/Bear Divider (Redline).
EXIST Signal:-
*Red-Dot = Potentially a Top signal.
*Yellow-Dot = Potentially a Top signal.
*Red-Candle = Market at Downtrend sentiment.
*Candle color changed from BLUE to RED & Candle closed "BELOW" the Bull/Bear Divider (Redline)


TOP GLOVETop glove
base on weekly TF downtrend mood already finish 200% base on calculation FIBO, as per we can see on Monday top glove has rebound and rejection

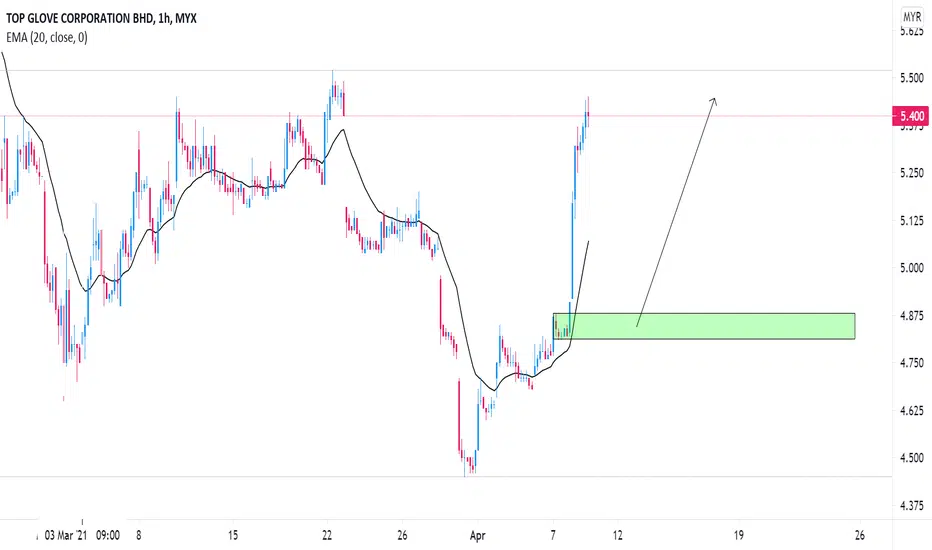
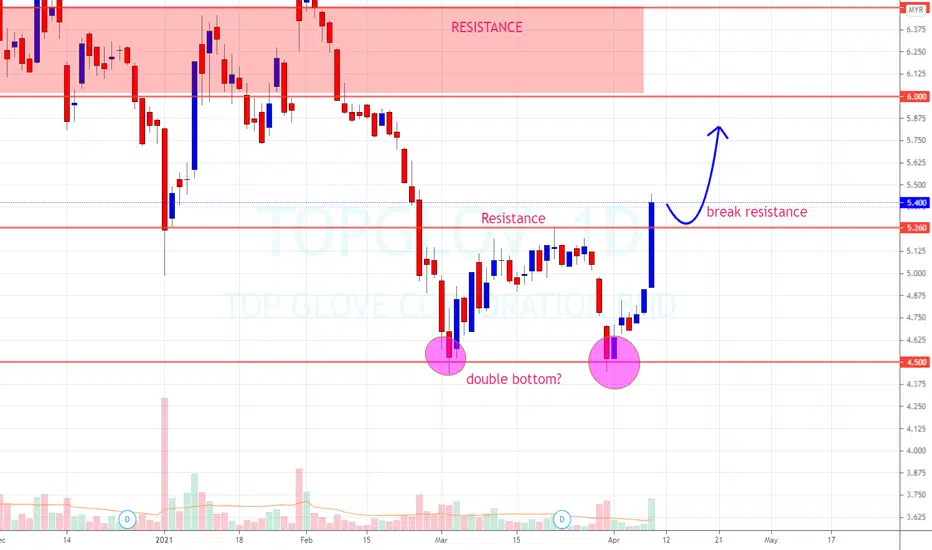
TOPGLOV double bottom?after 2nd attempt on 4.50.. TG finally make a strong come back and break above 5.26
we are bullish bias on TG, seeing potential bounce in the market.
note, overall structure still bearish.
TOPGLOV Daily TimeframeUsing the same R/S since first analysis on Dec 2020.
Still valid on 2nd analysis dated 7 March 2021.
This is the 3rd update (8 April 2021).
Point of view ;
- Major trend = down trend
- Reversal = no strong reversal pattern or any kind of reversal point (even harmonic butterfly far yet to complete)
- Trendline = still valid
- M-Top = still valid and yet to reach target
- 1-2-3 = more than 1 movement with same confluence of direction (down)
- Dead Cat = high probability
- Trading Plan = FIFO, BOS and SOR, See Money Take Money


TOPGLOV - RSI Bullish DivergenceTOPGLOV
Theme: Glove
Rst: 5.00
Spp: 4.72
Resurgence of candlestick above critical support level 4.72, meaning RSI bullish divergence is kicking in their effect into Daily chart from 4H chart now. My expectation the effect shall last until middle BB area.

TOPGLOV - BULLISH IMPULSE SOONWith coronavirus outbreak in 2020, glove stocks have seen immense upside.
However, since August 2020 until now (April 2021) - it has been in a lengthy correction as if there's no hope left and uncertain whether or not glove stocks could still perform in the future.
Utilizing Elliott Wave Theory, it is likely that we are about to complete a Flat Correction (A-B-C) with Ending Diagonal.
Breaking above 5.520 will likely imply that the bottom is in, and we could easily see a conservative target of 10.00
This is purely from Technical Analysis perspective, disregarding its fundamentals.

no love for top glove
US CBP finds Top Glove products manufactured using convict, forced, indentured labour
TheEdge Mon, Mar 29, 2021 04:36pm - 3 hours ago
price will first test the support at 4.90, which it will most likely break. next, i expect a waterfall to the 3.50 region. this is the last line of defense. if broken, im afraid price might fall even further to 2+ region.
disclaimer: this is not a buy/sell call, but merely my personal opinion. always tayor.
