Mizuho Financial Group, Inc. | Chart & Forecast SummaryKey Indicators On Trade Set Up In General
1. Push Set Up
2. Range Set up
3. Break & Retest Set Up
Notes On Session
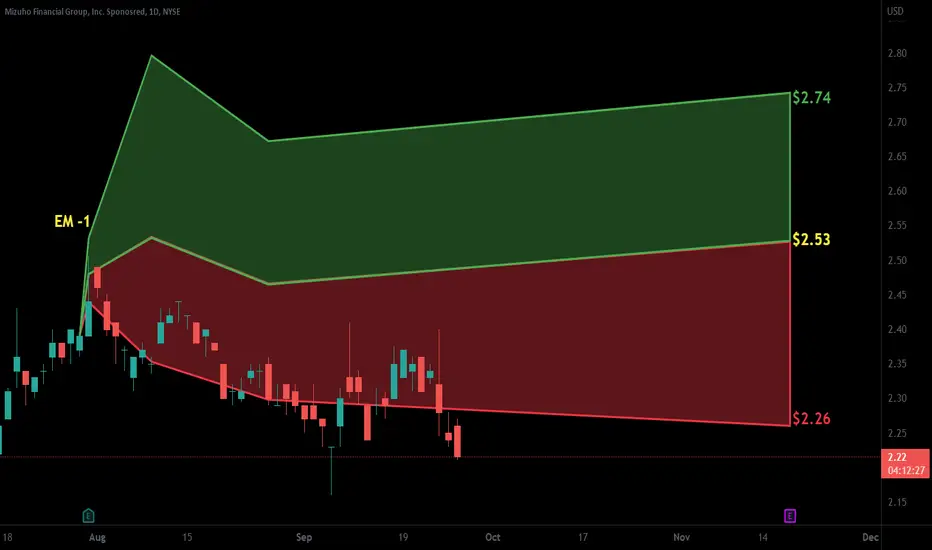
# Mizuho Financial Group, Inc.
- Double Formation
* 012345 | Wave Count Survey Completed | Subdivision 1
* (Neckline) At 3.200.00 JPY
- Triple Formation
* (Flag Structure) | Uptrend B
Mizuho Financial Group Inc.
No trades
Next report date
—
Report period
—
EPS estimate
—
Revenue estimate
—
2.69 USD
5.90 B USD
58.54 B USD
2.32 B
About Mizuho Financial Group, Inc.
Sector
Industry
CEO
Masahiro Kihara
Website
Headquarters
Tokyo
Founded
1864
IPO date
Mar 12, 2003
Identifiers
2
ISIN JP3885780001
Mizuho Financial Group, Inc. operates as a holding company which engages in the provision of financial services such as banking, trust banking, securities, and others. It operates through the following segments: Mizuho Bank Ltd. (MHKB), Mizuho Trust & Banking Co., Ltd. (MHTB), and Mizuho Securities Co., Ltd. (MHSC). The Mizuho Bank Ltd. segment includes personal, retail, corporate, international banking, financial institutions, public sector, and trading services. The Mizuho Trust & Banking Co., Ltd. provides services related to trust, real estate, securitization, structured finance, pension and asset management, and stock transfer agency. The Mizuho Securities Co., Ltd. offers security services to individuals, corporations, financial institutions and public sector entities. The company was founded in 1864 and is headquartered in Tokyo, Japan.
Related stocks

8411 on TSEThe market is on uptrend so buying is good. The demand level has a good structure and profit margin.

8411 (Mizuho Financial Group) - Strong Upside Follow-Through8411 (Mizuho Financial Group) - Strong Upside Follow-Through
The green shaded area represents the post-idea price development.
The original idea is attached.

8411 (Mizuho Financial Group)Mizuho Financial Group, Inc., abbreviated as MHFG, or simply called Mizuho, is a banking holding company headquartered in the Ōtemachi district of Chiyoda, Tokyo, Japan. The name "mizuho" literally means "abundant rice" in Japanese and "harvest" in the figurative sense.
Potential Swing Buy/Long.

$MFG with a neutral outlook following its earnings #Stocks The PEAD projected a Neutral outlook for $MFG after a positive over reaction following its earnings release placing the stock in drift B with an expected accuracy of 70%.

MFG: Long term strategyThis chart indicates a strong relation of MFG (generally applies to most bank stocks) with gov yield rates - 5 year Japanese bond in this case.
Considering the chart pattern, there is still a possibility of testing a bottom for a couple of months, but the stock price should soon catch up with the yi

$MFG with a Bullish outlook following its earnings #Stocks The PEAD projected a Bullish outlook for $MFG after a Positive Under reaction following its earnings release placing the stock in drift A with an expected accuracy of 75%.

$MFG with a Bullish outlook following its earnings #Stocks The PEAD projected a Bullish outlook for $MFG after a Positive Under reaction following its earnings release placing the stock in drift A.
$MFG with a Neutral outlook following its earnings #Stocks The PEAD projected a Neutral outlook for $MFG after a Positive Under reaction following its earnings release placing the stock in drift B with an expected accuracy of 66.67%.


See all ideas
Summarizing what the indicators are suggesting.
Neutral
SellBuy
Strong sellStrong buy
Strong sellSellNeutralBuyStrong buy
Neutral
SellBuy
Strong sellStrong buy
Strong sellSellNeutralBuyStrong buy
Neutral
SellBuy
Strong sellStrong buy
Strong sellSellNeutralBuyStrong buy
An aggregate view of professional's ratings.
Neutral
SellBuy
Strong sellStrong buy
Strong sellSellNeutralBuyStrong buy
Neutral
SellBuy
Strong sellStrong buy
Strong sellSellNeutralBuyStrong buy
Neutral
SellBuy
Strong sellStrong buy
Strong sellSellNeutralBuyStrong buy
Displays a symbol's price movements over previous years to identify recurring trends.
XS2594990892
Mizuho Financial Group, Inc. 5.628% 13-JUN-2028Yield to maturity
5.31%
Maturity date
Jun 13, 2028
MFG5255639
Mizuho Financial Group, Inc. 2.564% 13-SEP-2031Yield to maturity
4.50%
Maturity date
Sep 13, 2031
USJ4599LAL6
Mizuho Financial Group, Inc. 3.477% 12-APR-2026Yield to maturity
4.33%
Maturity date
Apr 12, 2026
US60687YAG4
Mizuho Financial Group, Inc. 2.839% 13-SEP-2026Yield to maturity
3.97%
Maturity date
Sep 13, 2026
MFG4538733
Mizuho Financial Group, Inc. 3.17% 11-SEP-2027Yield to maturity
3.84%
Maturity date
Sep 11, 2027
See all MZHOF bonds
Frequently Asked Questions
The current price of MZHOF is 50.04 USD — it has decreased by −4.01% in the past 24 hours. Watch Mizuho Financial Group Inc. stock price performance more closely on the chart.
Depending on the exchange, the stock ticker may vary. For instance, on OTC exchange Mizuho Financial Group Inc. stocks are traded under the ticker MZHOF.
MZHOF stock has risen by 2.62% compared to the previous week, the month change is a 26.91% rise, over the last year Mizuho Financial Group Inc. has showed a 71.46% increase.
We've gathered analysts' opinions on Mizuho Financial Group Inc. future price: according to them, MZHOF price has a max estimate of 62.03 USD and a min estimate of 29.48 USD. Watch MZHOF chart and read a more detailed Mizuho Financial Group Inc. stock forecast: see what analysts think of Mizuho Financial Group Inc. and suggest that you do with its stocks.
MZHOF reached its all-time high on Aug 10, 2006 with the price of 8,241.30 USD, and its all-time low was 0.98 USD and was reached on Mar 23, 2020. View more price dynamics on MZHOF chart.
See other stocks reaching their highest and lowest prices.
See other stocks reaching their highest and lowest prices.
MZHOF stock is 9.33% volatile and has beta coefficient of 1.96. Track Mizuho Financial Group Inc. stock price on the chart and check out the list of the most volatile stocks — is Mizuho Financial Group Inc. there?
Today Mizuho Financial Group Inc. has the market capitalization of 127.19 B, it has increased by 8.51% over the last week.
Yes, you can track Mizuho Financial Group Inc. financials in yearly and quarterly reports right on TradingView.
Mizuho Financial Group Inc. is going to release the next earnings report on May 14, 2026. Keep track of upcoming events with our Earnings Calendar.
MZHOF earnings for the last quarter are 0.85 USD per share, whereas the estimation was 0.69 USD resulting in a 22.99% surprise. The estimated earnings for the next quarter are 0.55 USD per share. See more details about Mizuho Financial Group Inc. earnings.
Mizuho Financial Group Inc. revenue for the last quarter amounts to 6.06 B USD, despite the estimated figure of 5.25 B USD. In the next quarter, revenue is expected to reach 5.54 B USD.
MZHOF net income for the last quarter is 2.11 B USD, while the quarter before that showed 2.70 B USD of net income which accounts for −22.03% change. Track more Mizuho Financial Group Inc. financial stats to get the full picture.
Mizuho Financial Group Inc. dividend yield was 3.46% in 2024, and payout ratio reached 39.98%. The year before the numbers were 3.45% and 39.20% correspondingly. See high-dividend stocks and find more opportunities for your portfolio.
As of Feb 14, 2026, the company has 52.55 K employees. See our rating of the largest employees — is Mizuho Financial Group Inc. on this list?
Like other stocks, MZHOF shares are traded on stock exchanges, e.g. Nasdaq, Nyse, Euronext, and the easiest way to buy them is through an online stock broker. To do this, you need to open an account and follow a broker's procedures, then start trading. You can trade Mizuho Financial Group Inc. stock right from TradingView charts — choose your broker and connect to your account.
Investing in stocks requires a comprehensive research: you should carefully study all the available data, e.g. company's financials, related news, and its technical analysis. So Mizuho Financial Group Inc. technincal analysis shows the buy rating today, and its 1 week rating is strong buy. Since market conditions are prone to changes, it's worth looking a bit further into the future — according to the 1 month rating Mizuho Financial Group Inc. stock shows the buy signal. See more of Mizuho Financial Group Inc. technicals for a more comprehensive analysis.
If you're still not sure, try looking for inspiration in our curated watchlists.
If you're still not sure, try looking for inspiration in our curated watchlists.