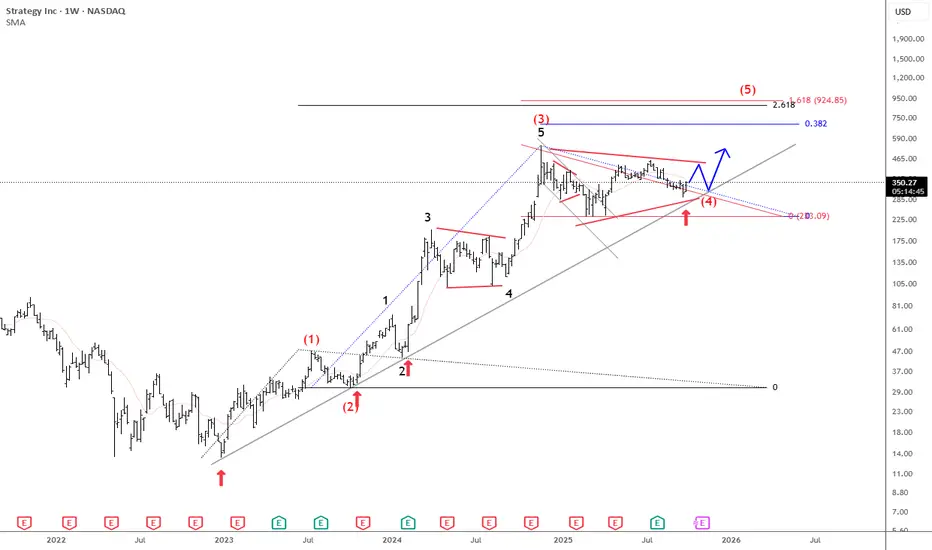
Microstrategy Is Still Pointing Higher For The Final 5th WaveMicrostrategy is a US business intelligence and software company, but it has become best known for its aggressive Bitcoin strategy. Under co-founder Michael Saylor, the company shifted from focusing mainly on software to also using Bitcoin as its primary treasury reserve asset.
Since 2020, MicroStra
Next report date
—
Report period
—
EPS estimate
—
Revenue estimate
—
14.99 USD
−1.17 B USD
463.46 M USD
263.35 M
About Strategy Inc
Sector
Industry
CEO
Phong Q. Le
Website
Headquarters
Vienna
Founded
1989
ISIN
US5949724083
FIGI
BBG000GQJPZ0
Strategy, Inc. engages in the provision of enterprise analytics and mobility software. The firm designs, develops, markets, and sells software platforms through licensing arrangements and cloud-based subscriptions and related services. Its product packages include Hyper. The company was founded by Michael J. Saylor and Sanjeev K. Bansal on November 17, 1989, and is headquartered in Vienna, VA.
Related stocks
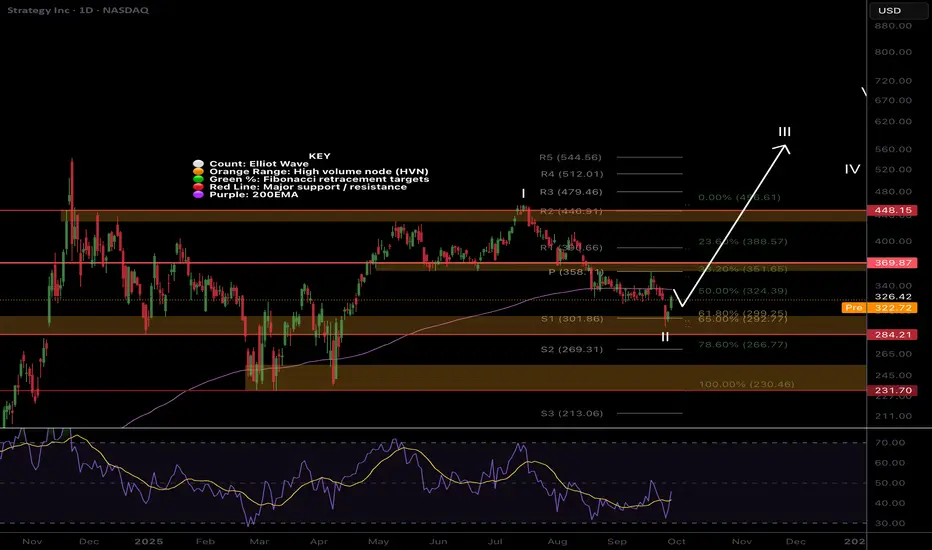
MSTR Wave II bottom?NASDAQ:MSTR is finally catching a bid from the triple support zone of the Fibonacci golden pocket, S1 pivot and High Volume Node.
It must overcome the daily 200EMA to add confidence to a reversal and wave II bottom being in.
Daily RSI has printed bullish divergence from oversold. Vanguard disclos
Breaking: MicroStrategy's Bitcoin Holdings Signal Breakout Current Price: $309.06
Direction: LONG
Targets:
- T1 = $325.00
- T2 = $340.00
Stop Levels:
- S1 = $300.00
- S2 = $290.00
**Wisdom of Professional Traders:**
This analysis synthesizes insights from thousands of professional traders and market experts, leveraging collective intel
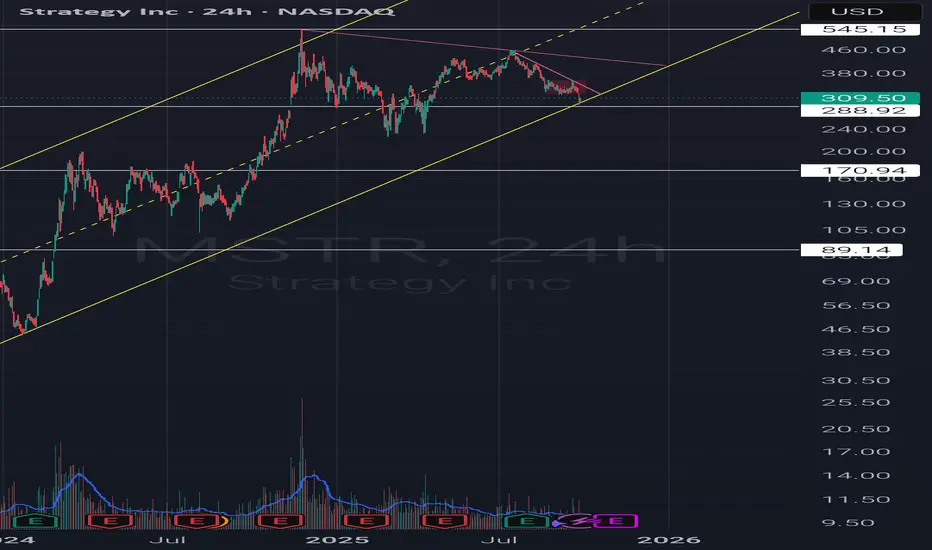
MSTR back to ATH?1. MSTR has been trading in a long-term upward channel, respecting both support and resistance lines.
2. The current pullback seems to be a consolidation phase within this bullish structure.
3. Price recently touched the lower boundary of the channel, suggesting strong technical support.
4. Histo
MSTR Is A BuyHello,
It may drop again to $270 level before a big rally.
Targets:
1) $400
2) $543 ATH
3) $600

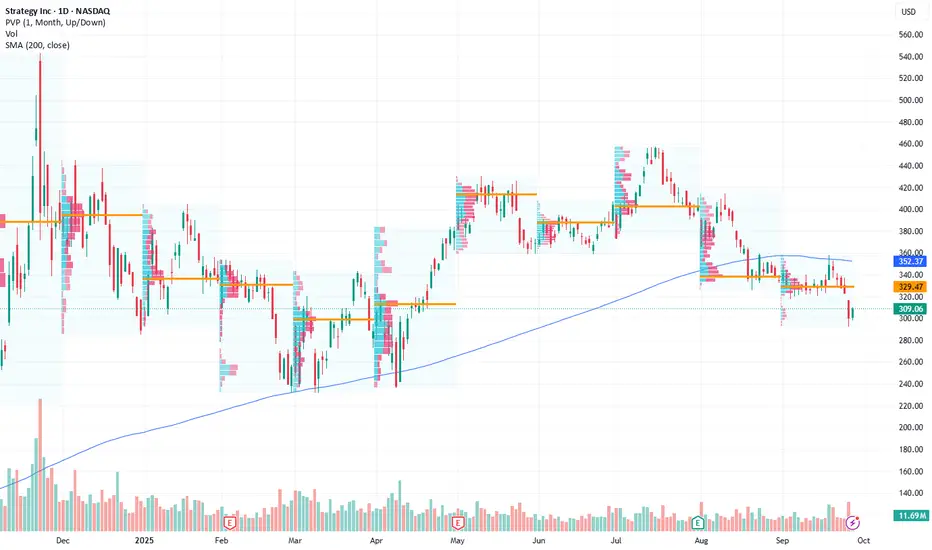
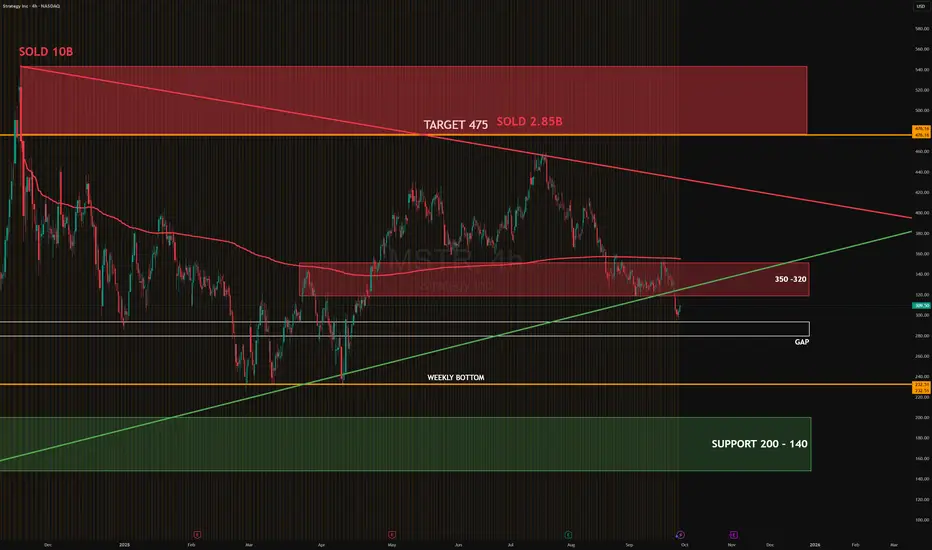
MSTR CORRECTION OCT 2025Price action in MSTR shows rejection from the 350–320 supply zone, with institutional selling pressure still present. The breakdown opens risk of gap filling below 300, with a weekly bottom as the next reference. Heavy absorption could only resume if the price reclaims 320.
# Upside target: 350–320
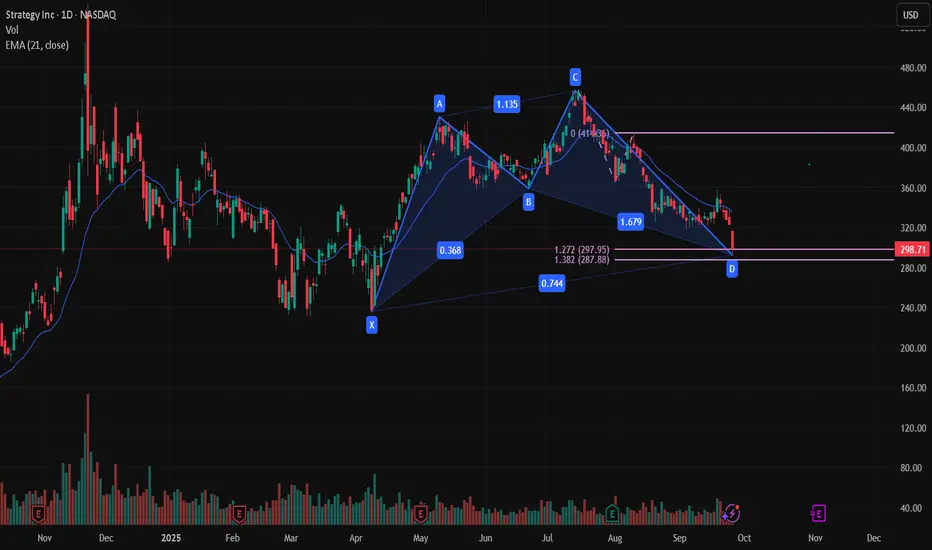
$MSTR Bullish Cypher patternNASDAQ:MSTR This bullish Cypher pattern has a much better look. All depend on a strong bounce in Bitcoin now.
What's the fate of MSTR? MSTR is showing a sign for a long opportunity. However, there hasn't been a confirmation yet.
The stock is in oversold region and price has respected both bullish trendline and support level. Once there's a breakout of the bearish trendline and green bar is formed on the awesome oscillator, then y

$MSTR to push above $400 again?NASDAQ:MSTR had it's 3rd touch off this blue trend line and usually when it does that, it forms a strong move in the other direction.
As long as this trend line holds, I think it's likely that we can see a move back above $400.
I've marked off key levels as resistance.
Took calls between $367.5

MSTR Riding Momentum – Can $345 Gamma Resistance Break? (Oct 2)Intraday (15-Min Chart)
MicroStrategy surged strongly, climbing into the $338–$343 zone before consolidating along the rising channel. On the 15-min chart, price is tracking its upper trendline with MACD momentum turning positive again, while Stoch RSI is extended but still supportive.
* Immediate r

See all ideas
Summarizing what the indicators are suggesting.
Neutral
SellBuy
Strong sellStrong buy
Strong sellSellNeutralBuyStrong buy
Neutral
SellBuy
Strong sellStrong buy
Strong sellSellNeutralBuyStrong buy
Neutral
SellBuy
Strong sellStrong buy
Strong sellSellNeutralBuyStrong buy
An aggregate view of professional's ratings.
Neutral
SellBuy
Strong sellStrong buy
Strong sellSellNeutralBuyStrong buy
Neutral
SellBuy
Strong sellStrong buy
Strong sellSellNeutralBuyStrong buy
Neutral
SellBuy
Strong sellStrong buy
Strong sellSellNeutralBuyStrong buy
Displays a symbol's price movements over previous years to identify recurring trends.
MSTR6034213
Strategy Inc 0.875% 15-MAR-2031Yield to maturity
—
Maturity date
Mar 15, 2031
MSTR6032672
Strategy Inc 0.625% 15-MAR-2030Yield to maturity
—
Maturity date
Mar 15, 2030
MSTR5946535
Strategy Inc 0.0% 01-DEC-2029Yield to maturity
—
Maturity date
Dec 1, 2029
US594972AT8
Strategy Inc 0.0% 01-MAR-2030Yield to maturity
—
Maturity date
Mar 1, 2030
US594972AN1
Strategy Inc 2.25% 15-JUN-2032Yield to maturity
—
Maturity date
Jun 15, 2032
US594972AR2
Strategy Inc 0.0% 01-DEC-2029Yield to maturity
—
Maturity date
Dec 1, 2029
US594972AQ4
Strategy Inc 0.625% 15-SEP-2028Yield to maturity
—
Maturity date
Sep 15, 2028
See all MSTR bonds
MSTE
Harvest MicroStrategy Enhanced High Income Shares ETF Trust Unit AWeight
131.16%
Market value
343.68 M
USD
WLDH
Amundi MSCI World Swap II UCITS ETF Act -Monthly Hedged to EUR - Dist-Weight
2.06%
Market value
239.29 M
USD
Explore more ETFs
Curated watchlists where MSTR is featured.


Frequently Asked Questions
The current price of MSTR is 351.63 USD — it has decreased by −0.20% in the past 24 hours. Watch Strategy Inc stock price performance more closely on the chart.
Depending on the exchange, the stock ticker may vary. For instance, on NASDAQ exchange Strategy Inc stocks are traded under the ticker MSTR.
MSTR stock has risen by 16.70% compared to the previous week, the month change is a 2.88% rise, over the last year Strategy Inc has showed a 115.21% increase.
We've gathered analysts' opinions on Strategy Inc future price: according to them, MSTR price has a max estimate of 705.00 USD and a min estimate of 175.00 USD. Watch MSTR chart and read a more detailed Strategy Inc stock forecast: see what analysts think of Strategy Inc and suggest that you do with its stocks.
MSTR reached its all-time high on Nov 21, 2024 with the price of 543.00 USD, and its all-time low was 0.42 USD and was reached on Jul 3, 2002. View more price dynamics on MSTR chart.
See other stocks reaching their highest and lowest prices.
See other stocks reaching their highest and lowest prices.
MSTR stock is 4.11% volatile and has beta coefficient of 0.90. Track Strategy Inc stock price on the chart and check out the list of the most volatile stocks — is Strategy Inc there?
Today Strategy Inc has the market capitalization of 99.71 B, it has decreased by −0.34% over the last week.
Yes, you can track Strategy Inc financials in yearly and quarterly reports right on TradingView.
Strategy Inc is going to release the next earnings report on Nov 4, 2025. Keep track of upcoming events with our Earnings Calendar.
MSTR earnings for the last quarter are 32.60 USD per share, whereas the estimation was −0.10 USD resulting in a 33.25 K% surprise. The estimated earnings for the next quarter are −0.10 USD per share. See more details about Strategy Inc earnings.
Strategy Inc revenue for the last quarter amounts to 114.49 M USD, despite the estimated figure of 113.54 M USD. In the next quarter, revenue is expected to reach 117.72 M USD.
MSTR net income for the last quarter is 10.02 B USD, while the quarter before that showed −4.22 B USD of net income which accounts for 337.61% change. Track more Strategy Inc financial stats to get the full picture.
No, MSTR doesn't pay any dividends to its shareholders. But don't worry, we've prepared a list of high-dividend stocks for you.
As of Oct 4, 2025, the company has 1.53 K employees. See our rating of the largest employees — is Strategy Inc on this list?
EBITDA measures a company's operating performance, its growth signifies an improvement in the efficiency of a company. Strategy Inc EBITDA is −26.12 M USD, and current EBITDA margin is −5.29%. See more stats in Strategy Inc financial statements.
Like other stocks, MSTR shares are traded on stock exchanges, e.g. Nasdaq, Nyse, Euronext, and the easiest way to buy them is through an online stock broker. To do this, you need to open an account and follow a broker's procedures, then start trading. You can trade Strategy Inc stock right from TradingView charts — choose your broker and connect to your account.
Investing in stocks requires a comprehensive research: you should carefully study all the available data, e.g. company's financials, related news, and its technical analysis. So Strategy Inc technincal analysis shows the buy rating today, and its 1 week rating is buy. Since market conditions are prone to changes, it's worth looking a bit further into the future — according to the 1 month rating Strategy Inc stock shows the strong buy signal. See more of Strategy Inc technicals for a more comprehensive analysis.
If you're still not sure, try looking for inspiration in our curated watchlists.
If you're still not sure, try looking for inspiration in our curated watchlists.