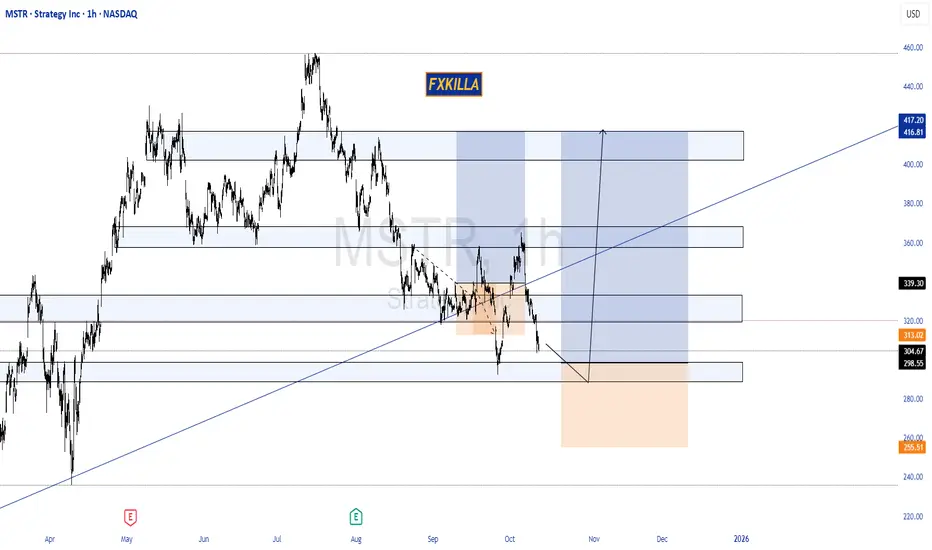
MSTR LongThe broader market structure on MSTR (15-minute) remains bearish, characterized by a series of lower highs and lower lows. The most recent Break of Structure (BOS) occurred around $309.34, confirming continuation to the downside after price failed to sustain above prior support. No Change of Charact
Next report date
—
Report period
—
EPS estimate
—
Revenue estimate
—
14.99 USD
−1.17 B USD
463.46 M USD
263.40 M
About Strategy Inc
Sector
Industry
CEO
Phong Q. Le
Website
Headquarters
Vienna
Founded
1989
ISIN
US5949724083
FIGI
BBG000GQJPZ0
Strategy, Inc. engages in the provision of enterprise analytics and mobility software. The firm designs, develops, markets, and sells software platforms through licensing arrangements and cloud-based subscriptions and related services. Its product packages include Hyper. The company was founded by Michael J. Saylor and Sanjeev K. Bansal on November 17, 1989, and is headquartered in Vienna, VA.
Related stocks

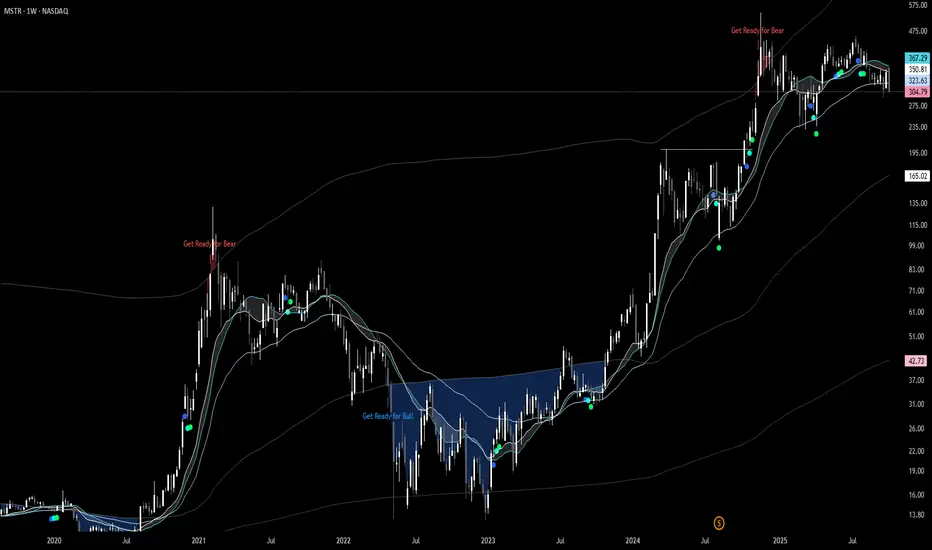
MSTR Looking at the marco charts, this looks like a classic wyckoff accumulation bottom. Typically at these zones, theres no confidence sentiment in hopes of the stock market to fully recover. Prehistoric data has shown these are the best times to start buying into the fear & uncertainty.
With bloody i

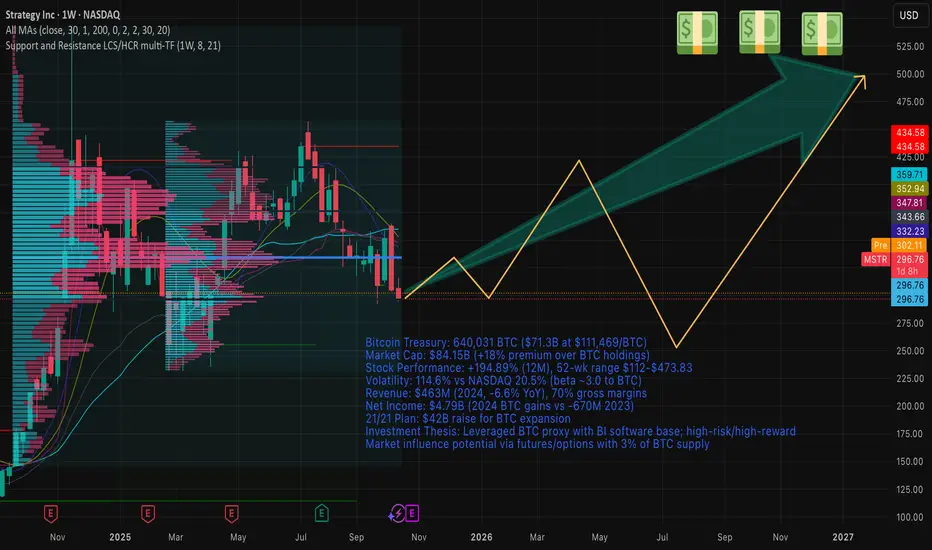
Strategy Inc. (NASDAQ: MSTR) - Financial ReportDate: October 16, 2025
Current Market Context:
As of October 16, 2025, Bitcoin trades at approximately $111,469 USD, reflecting a volatile yet upward trajectory influenced by institutional adoption and macroeconomic factors.
Strategy Inc., formerly MicroStrategy, holds 640,031 BTC, valued at $71
MSTR It almost looks similar as past movements. 285 was expected and came yesterday.
In November and December MSTR will go up and upper. It completed correction and I am waiting Long on it.

MSTR HIGH PROBABILITY SETUP SOON!!!🚨 MSTR HIGH PROBABILITY BUY SETUP 🚨
* Here We Can See Clearly The Next Potential Move For MSTR Coming Hours/Days.
* Keep Your Eyes Close On Your Trading Positions.
* Happy PIP Hunting Traders.
FXKILLA.
MSTR - legendary cypher Possibly going for final test of key trend line and historic S/R zone one more time... but who knows. Love the massive ascending triangle into ATH.

Aggressive Bitcoin Strategy Could Propel GainsCurrent Price: $304.79
Direction: LONG
Targets:
- T1 = $320.00
- T2 = $340.00
Stop Levels:
- S1 = $295.00
- S2 = $280.00
**Wisdom of Professional Traders:**
This analysis synthesizes insights from thousands of professional traders and market experts, leveraging collective intel


MSTR: Trend ContinuesSince our last update, MSTR extended its sell-off. We still expect the low of this wave to form above the support level at $153.49. Once wave 2 is complete, we anticipate a strong wave 3 rally pushing above resistance at $674.18. Our alternative scenario assumes a different wave count: in this case,

MSTR Is CookedRegardless of what happens with BTC, MSTR is done. Way too many signals for MSTR. Unfortunately, the present MSTR situation gives me pause about BTC's next few weeks to months. As always, time will tell.
See all ideas
Summarizing what the indicators are suggesting.
Neutral
SellBuy
Strong sellStrong buy
Strong sellSellNeutralBuyStrong buy
Neutral
SellBuy
Strong sellStrong buy
Strong sellSellNeutralBuyStrong buy
Neutral
SellBuy
Strong sellStrong buy
Strong sellSellNeutralBuyStrong buy
An aggregate view of professional's ratings.
Neutral
SellBuy
Strong sellStrong buy
Strong sellSellNeutralBuyStrong buy
Neutral
SellBuy
Strong sellStrong buy
Strong sellSellNeutralBuyStrong buy
Neutral
SellBuy
Strong sellStrong buy
Strong sellSellNeutralBuyStrong buy
Displays a symbol's price movements over previous years to identify recurring trends.
MSTR5946535
Strategy Inc 0.0% 01-DEC-2029Yield to maturity
—
Maturity date
Dec 1, 2029
MSTR6032672
Strategy Inc 0.625% 15-MAR-2030Yield to maturity
—
Maturity date
Mar 15, 2030
MSTR6034213
Strategy Inc 0.875% 15-MAR-2031Yield to maturity
—
Maturity date
Mar 15, 2031
US594972AN1
Strategy Inc 2.25% 15-JUN-2032Yield to maturity
—
Maturity date
Jun 15, 2032
US594972AT8
Strategy Inc 0.0% 01-MAR-2030Yield to maturity
—
Maturity date
Mar 1, 2030
US594972AQ4
Strategy Inc 0.625% 15-SEP-2028Yield to maturity
—
Maturity date
Sep 15, 2028
US594972AR2
Strategy Inc 0.0% 01-DEC-2029Yield to maturity
—
Maturity date
Dec 1, 2029
See all MSTR bonds
MSTE
Harvest MicroStrategy Enhanced High Income Shares ETF Trust Unit AWeight
126.91%
Market value
422.87 M
USD
SP5H
Multi Units Luxembourg SICAV - Amundi Core S&P 500 Swap Daily Hedged D EURWeight
0.86%
Market value
235.32 M
USD
SP5C
Multi Units Luxembourg SICAV - Amundi Core S&P 500 Swap C-EURWeight
0.86%
Market value
235.32 M
USD
Explore more ETFs
Curated watchlists where MSTR is featured.


Frequently Asked Questions
The current price of MSTR is 282.23 USD — it has decreased by −4.35% in the past 24 hours. Watch Strategy Inc stock price performance more closely on the chart.
Depending on the exchange, the stock ticker may vary. For instance, on NASDAQ exchange Strategy Inc stocks are traded under the ticker MSTR.
MSTR stock has fallen by −13.30% compared to the previous week, the month change is a −13.79% fall, over the last year Strategy Inc has showed a 46.38% increase.
We've gathered analysts' opinions on Strategy Inc future price: according to them, MSTR price has a max estimate of 705.00 USD and a min estimate of 175.00 USD. Watch MSTR chart and read a more detailed Strategy Inc stock forecast: see what analysts think of Strategy Inc and suggest that you do with its stocks.
MSTR reached its all-time high on Nov 21, 2024 with the price of 543.00 USD, and its all-time low was 0.42 USD and was reached on Jul 3, 2002. View more price dynamics on MSTR chart.
See other stocks reaching their highest and lowest prices.
See other stocks reaching their highest and lowest prices.
MSTR stock is 3.37% volatile and has beta coefficient of 0.96. Track Strategy Inc stock price on the chart and check out the list of the most volatile stocks — is Strategy Inc there?
Today Strategy Inc has the market capitalization of 80.48 B, it has decreased by −2.96% over the last week.
Yes, you can track Strategy Inc financials in yearly and quarterly reports right on TradingView.
Strategy Inc is going to release the next earnings report on Oct 30, 2025. Keep track of upcoming events with our Earnings Calendar.
MSTR earnings for the last quarter are 32.60 USD per share, whereas the estimation was −0.10 USD resulting in a 33.25 K% surprise. The estimated earnings for the next quarter are −0.10 USD per share. See more details about Strategy Inc earnings.
Strategy Inc revenue for the last quarter amounts to 114.49 M USD, despite the estimated figure of 113.54 M USD. In the next quarter, revenue is expected to reach 116.35 M USD.
MSTR net income for the last quarter is 10.02 B USD, while the quarter before that showed −4.22 B USD of net income which accounts for 337.61% change. Track more Strategy Inc financial stats to get the full picture.
No, MSTR doesn't pay any dividends to its shareholders. But don't worry, we've prepared a list of high-dividend stocks for you.
As of Oct 17, 2025, the company has 1.53 K employees. See our rating of the largest employees — is Strategy Inc on this list?
EBITDA measures a company's operating performance, its growth signifies an improvement in the efficiency of a company. Strategy Inc EBITDA is −26.12 M USD, and current EBITDA margin is −5.29%. See more stats in Strategy Inc financial statements.
Like other stocks, MSTR shares are traded on stock exchanges, e.g. Nasdaq, Nyse, Euronext, and the easiest way to buy them is through an online stock broker. To do this, you need to open an account and follow a broker's procedures, then start trading. You can trade Strategy Inc stock right from TradingView charts — choose your broker and connect to your account.
Investing in stocks requires a comprehensive research: you should carefully study all the available data, e.g. company's financials, related news, and its technical analysis. So Strategy Inc technincal analysis shows the sell today, and its 1 week rating is sell. Since market conditions are prone to changes, it's worth looking a bit further into the future — according to the 1 month rating Strategy Inc stock shows the buy signal. See more of Strategy Inc technicals for a more comprehensive analysis.
If you're still not sure, try looking for inspiration in our curated watchlists.
If you're still not sure, try looking for inspiration in our curated watchlists.