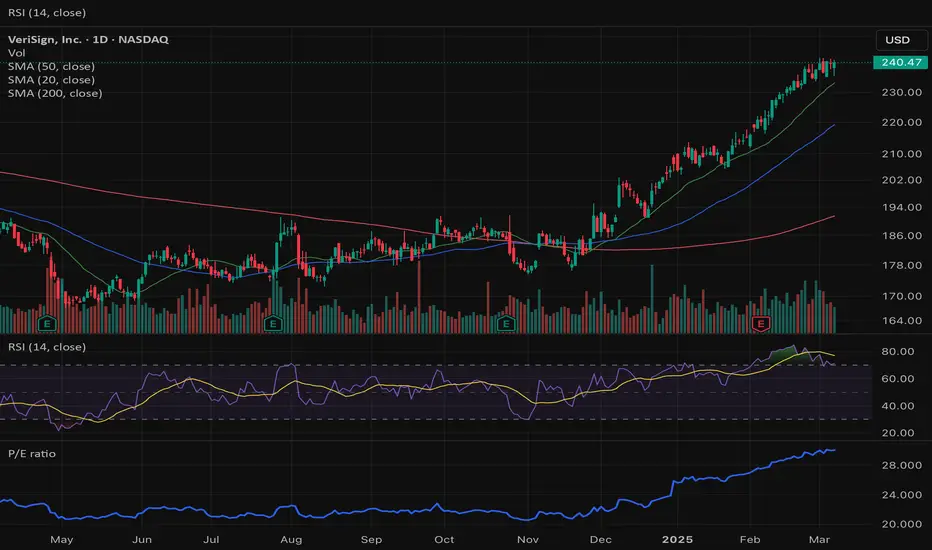
VRSN: Double Bottom terminated C-Wave Extension – Impulse Wave?Background:
The impulsive wave count invalidated after the post-earnings plunge (2/6 208.86), leading to an extended C-wave.
However, VRSN successfully found support at its 52-week low of 208.86. The subsequent retest at 212 on Feb 11-12 formed a solid Double Bottom, signaling the exhaustion of s
Next report date
—
Report period
—
EPS estimate
—
Revenue estimate
—
8.83 USD
825.70 M USD
1.66 B USD
90.81 M
About VeriSign, Inc.
Sector
Industry
CEO
D. James Bidzos
Website
Headquarters
Reston
Founded
1995
IPO date
Jan 30, 1998
Identifiers
3
ISIN US92343E1029
VeriSign, Inc. engages in the provision of critical Internet infrastructure and domain name registry services. It helps enable the security, stability, and resiliency of the Domain Name System and the Internet by providing Root Zone Maintainer services. The company was founded by D. James Bidzos on April 12, 1995 and is headquartered in Reston, VA.
Related stocks

VRSN: ABC Correction Nearing End? Wave 3 Buy Setup Emerging?After completing a major Impulse Wave topping at the July 2025 ATH of $310.60, VRSN entered a larger-degree ABC correction that now appears close to completion. Wave C bottomed in the 231.00–236.26 zone (strong confluence: Fib 38.2–50% retracement + prior lows + volume spike).
We are now in the ear

Another leg up for VRSN? Will VRSN hold support around that $277 area? I think we can see a retest around there soon and then a new all time high shortly after and retest the top of the channel resistance.

VeriSign (VRSN) | Breakout or Rejection at $290?Price is consolidating around $281–282 after bouncing strongly from the $272 support zone.The stock is close to testing the $286–290 resistance area, which has acted as a ceiling multiple times in recent months.
Key Support & Resistance
Immediate Support: $275 / $272 (major demand zone, buyers

VRSN US ( VeriSign) LongVeriSign is a key player in the management of .com and .net domain names, processing over 132 billion DNS queries per day
VeriSign has a near-monopoly position in the management of .com and .net domains (146.4 million registered addresses)
Domain renewal rates have increased to 75.5%
EPS was $2.2

Same price as dot com bubble $VRSNSame price as dot com bubble $VRSN. Cup and handle? TD9? Break out or break down?

Buffet loves it, but...Fundamentals do not justify current valuation. Short at 240 as a hedge to my GOOG and AMZN positions
VRSN - VeriSign has reached it's upper extremeThe white up-sloping Fork gives us the most probable path of price for VRSN.
As we see, that was a Hell of a run.
Price has reached the U-MLH, which is the natural Extreme by the law of physics.
What's the natural reaction?
A move back to the Mean.
What's the Mean?
The Center-Line.
This is a hig

Three Ws and great result 4th in the making.It Created 4 Ws on Daily Time frames.
Two with Double Top and Two with Thriple Top.
The Trend line of First W was not broken and the price went up
The Trend line of next two Ws with Thripple Top broken and the price Went down.
As per this trend the current W is with Double top we will wait for a

VRSN - Short term trading opportunityMoving averages, trend lines, and oscillators indicate an upward movement in the short term.
Find the PRZ and TP levels on the graph.

See all ideas
Summarizing what the indicators are suggesting.
Neutral
SellBuy
Strong sellStrong buy
Strong sellSellNeutralBuyStrong buy
Neutral
SellBuy
Strong sellStrong buy
Strong sellSellNeutralBuyStrong buy
Neutral
SellBuy
Strong sellStrong buy
Strong sellSellNeutralBuyStrong buy
An aggregate view of professional's ratings.
Neutral
SellBuy
Strong sellStrong buy
Strong sellSellNeutralBuyStrong buy
Neutral
SellBuy
Strong sellStrong buy
Strong sellSellNeutralBuyStrong buy
Neutral
SellBuy
Strong sellStrong buy
Strong sellSellNeutralBuyStrong buy
Displays a symbol's price movements over previous years to identify recurring trends.
VRSN6021523
VeriSign, Inc. 5.25% 01-JUN-2032Yield to maturity
4.84%
Maturity date
Jun 1, 2032
VRSN4514587
VeriSign, Inc. 4.75% 15-JUL-2027Yield to maturity
4.66%
Maturity date
Jul 15, 2027
VRSN5191102
VeriSign, Inc. 2.7% 15-JUN-2031Yield to maturity
4.62%
Maturity date
Jun 15, 2031
VRSN4514585
VeriSign, Inc. 4.75% 15-JUL-2027Yield to maturity
3.62%
Maturity date
Jul 15, 2027
VRSN4514586
VeriSign, Inc. 4.75% 15-JUL-2027Yield to maturity
—
Maturity date
Jul 15, 2027
See all VRSN bonds
Frequently Asked Questions
The current price of VRSN is 219.03 USD — it has increased by 0.40% in the past 24 hours. Watch VeriSign, Inc. stock price performance more closely on the chart.
Depending on the exchange, the stock ticker may vary. For instance, on NASDAQ exchange VeriSign, Inc. stocks are traded under the ticker VRSN.
VRSN stock has fallen by −10.45% compared to the previous week, the month change is a −11.09% fall, over the last year VeriSign, Inc. has showed a −3.87% decrease.
We've gathered analysts' opinions on VeriSign, Inc. future price: according to them, VRSN price has a max estimate of 305.00 USD and a min estimate of 271.00 USD. Watch VRSN chart and read a more detailed VeriSign, Inc. stock forecast: see what analysts think of VeriSign, Inc. and suggest that you do with its stocks.
VRSN reached its all-time high on Jul 28, 2025 with the price of 310.60 USD, and its all-time low was 3.92 USD and was reached on Oct 9, 2002. View more price dynamics on VRSN chart.
See other stocks reaching their highest and lowest prices.
See other stocks reaching their highest and lowest prices.
VRSN stock is 2.59% volatile and has beta coefficient of 0.67. Track VeriSign, Inc. stock price on the chart and check out the list of the most volatile stocks — is VeriSign, Inc. there?
Today VeriSign, Inc. has the market capitalization of 20.09 B, it has decreased by −9.73% over the last week.
Yes, you can track VeriSign, Inc. financials in yearly and quarterly reports right on TradingView.
VeriSign, Inc. is going to release the next earnings report on Apr 23, 2026. Keep track of upcoming events with our Earnings Calendar.
VRSN earnings for the last quarter are 2.23 USD per share, whereas the estimation was 2.35 USD resulting in a −5.26% surprise. The estimated earnings for the next quarter are 2.30 USD per share. See more details about VeriSign, Inc. earnings.
VeriSign, Inc. revenue for the last quarter amounts to 425.30 M USD, despite the estimated figure of 424.38 M USD. In the next quarter, revenue is expected to reach 424.16 M USD.
VRSN net income for the last quarter is 206.20 M USD, while the quarter before that showed 212.80 M USD of net income which accounts for −3.10% change. Track more VeriSign, Inc. financial stats to get the full picture.
Yes, VRSN dividends are paid quarterly. The last dividend per share was 0.77 USD. As of today, Dividend Yield (TTM)% is 1.05%. Tracking VeriSign, Inc. dividends might help you take more informed decisions.
VeriSign, Inc. dividend yield was 0.95% in 2025, and payout ratio reached 26.24%. The year before the numbers were 0.00% and 0.00% correspondingly. See high-dividend stocks and find more opportunities for your portfolio.
As of Feb 16, 2026, the company has 928 employees. See our rating of the largest employees — is VeriSign, Inc. on this list?
EBITDA measures a company's operating performance, its growth signifies an improvement in the efficiency of a company. VeriSign, Inc. EBITDA is 1.15 B USD, and current EBITDA margin is 69.55%. See more stats in VeriSign, Inc. financial statements.
Like other stocks, VRSN shares are traded on stock exchanges, e.g. Nasdaq, Nyse, Euronext, and the easiest way to buy them is through an online stock broker. To do this, you need to open an account and follow a broker's procedures, then start trading. You can trade VeriSign, Inc. stock right from TradingView charts — choose your broker and connect to your account.
Investing in stocks requires a comprehensive research: you should carefully study all the available data, e.g. company's financials, related news, and its technical analysis. So VeriSign, Inc. technincal analysis shows the sell today, and its 1 week rating is strong sell. Since market conditions are prone to changes, it's worth looking a bit further into the future — according to the 1 month rating VeriSign, Inc. stock shows the sell signal. See more of VeriSign, Inc. technicals for a more comprehensive analysis.
If you're still not sure, try looking for inspiration in our curated watchlists.
If you're still not sure, try looking for inspiration in our curated watchlists.