TECK.B trade ideas


TECK: One of my old names from past trades. Good times.With China trade deal optimism and weather change can make this a great buying opp. Technically, this is ready to pop (see the trend line). I will keep an eye on this and open a medium dated call.
May be Apr 18th: 23 calls


TECK - Accumulation Zone (no TA pattern, but strong potential)Charts very obvious technical patterns over time, mostly double tops, with a few (I)H&S patterns. Price action is currently in a strong accumulation zone, and is prime for a decent bag to hold for take profits at 10%, then again around 16%. I don’t play with triple top resistances, but with some decent buy volume it could be a nice breakout - TECK is no stranger to a +20% run.

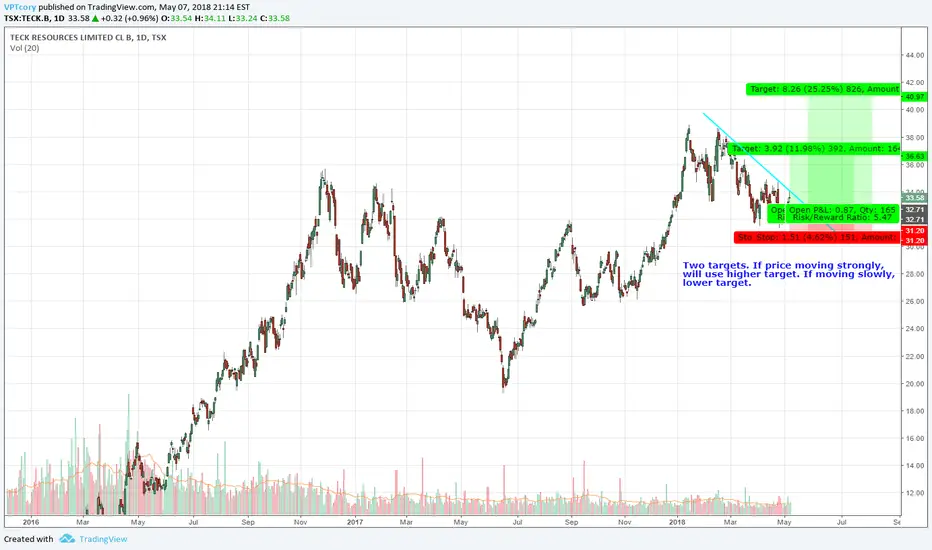
TECK.B Upswing TradeStrong uptrend, with price recently pulling back. Recent consolidation breakout to upside signaling the next up move could be underway. Decent reward:risk, even using the lower of the two targets. The higher target, or a trailing stop loss, will be used if the price rallies aggressively in the next several sessions. If it is meandering or slow, will get out at the lower target.
Disclosure: long
Another Upside Opportunity in TECK.B.TOStock has been strong to the upside, moving favorably on prior trades.
Price is ranging again after a strong run up and moving higher off support setting up another good reward:risk trade.

TECK it as it comes - and NOW, it commeth !Astonishing financials ! this jewel may bring us a $10 pop (from these levels) with the gold/miner surge
TECK it or leave it - but do not negate that "I TOLD U SO " /gl


TECK: BullishLarge 4-Year Inverse Head & Shoulders
Smaller 1-Year Inverse Head & Shoulders continuation pattern
Currently consolidating, current pullback is fairly light volume.
I bought a small position with a stop around the 50 ma. I will add more on a bullish pullback or if it breaks out higher, for a long term hold.
A trip to prior highs puts this between $55 and $62. I believe the coming inflation will be much worse.

TECK: looks good to me.Could use close< current uptrend line as stop. Process your way.
Analysts: Strong buy 10, Moderate buy 1, Hold 3, Strong sell 1.
"Teck Resources Ltd. is a diversified resource company, which is engaged in mining and mineral development with business units focused on copper, steelmaking coal, zinc and energy. The company produces specialty metals, which includes germanium and indium. Its activities related to mining and minerals processing including exploration, development, smelting, refining, safety, environmental protection, product stewardship, recycling and research. Teck Resources was founded on September 24, 1951 and is headquartered in Vancouver, Canada."

100% in the months ahead. From 35 to 70 $.Zink and Copper rising up. The Canadian Producer will double in price.

Bullish Gold Futures = Mining Companies (#8 TECK)Resuming a trend and breaking a resistance line. But always wait for the pullback after the breakout when the red candles appear around 25.00 and 27.00 level
Here again, similar patterns in different mining companies in the basic materials Industry. The same argument again based in price action and the breakout of resistance lines
My intention is to share several names who are showing a price strength because my job is to put names in the desk of the Managers and Traders and at the end they choose which one they need for your different purposes.
We never know which one will give the best yield. That's why it diversifies

TECK - inverse Head and Shoulders breakoutnice breakout of inverse head and shoulders pattern, measured move to ~38 or 50% upside . fits with commodity / copper story as well as CAD

Watching for Break Higher in TECK.B.TOBuying near support of this small triangle after a very strong rally in July and August. Provides a decent reward:risk with a target just below the late-2016 and early 2017 highs.
This has the potential to be a high momentum stock. Price target is a fine option, but if the price is running may want to consider using the ATR Stops as a trailing stop loss instead: when the price drops below the line, place a stop loss several cents below the low of that day.
As an added benefit, the company is strong earnings right now making for an attractive P/E.


TECK: ShortPreviously Teck gapped down from here with follow through and now has returned. I'm looking for a short term retracement at this supply level. Copper is currently in an up trend and hit a major supply area.


Short-Term Upside For Teck ResourcesTeck Resources has been in a clearly defined downward trend since November 2016. The trend does however cycle up and down very well. Currently the stock is at the bottom of the channel and due to rise for the reasons in this article.
When we take a look at other technical indicators, the relative strength index (RSI) is at 29.9555. RSI tends to determine trends, overbought and oversold levels as well as likelihood of price swings. I personally use anything above 75 as overbought and anything under 25 as oversold. The current reading has the stock flirting at the oversold level. This means the stock will rise at some point in the near future. This is the first indicator of a reversal to the upside.
The true strength index (TSI) is currently -15.73. The TSI determines overbought/oversold levels and/or current trend. I solely use this as an indicator of trend as overbought and oversold levels vary. The TSI is double smoothed in its calculation and is a great indicator of upward and downward movement. The current reading declares the stock has been trending down. Due to the delayed correlation in the movement of the stock, this indicator does not signal the bottom until after the fact. I have used light blue lines on the chart above when the bottom was reached for the stock. The current TSI position is roughly at the same point in the wave. This is the second indicator of a reversal to the upside.
The positive vortex indicator (VI) is at 0.7367 and the negative is at 1.1367. When the positive level is higher than 1 and higher than the negative indicator, the overall price action is moving upward. When the negative level is higher than 1 and higher than the positive indicator, the overall price action is moving downward. Currently the negative indicator is near the top of its cycle, meaning the stock should move up soon. This is the third indicator of a reversal to the upside.
The stochastic oscillator K value is 8.2772 and D value is 7.3369. This is a cyclical oscillator that is highly accurate and can be used to identify overbought/oversold levels as well as pending reversals and short-term activity. I personally use anything above 80 as overbought and below 20 as oversold. When the K value is higher than the D value, the stock is trending up. When the D value is higher that the K value the stock is trending down. Currently this indicator is clearly in oversold territory, due for upward movement in the stock soon. This is the fourth indicator of a reversal to the upside.
During the current trend channel, the stock has risen from bottom to top 3 times. On these movements, the median rise is 25% and median trading days to achieve the movement is 20 days.
Considering the moving average crossover, RSI, TSI, VI and stochastic levels, the overall direction clearly points to some sort of upward movement soon. Based on historical movement compared to current levels and the current position, the stock could gain at least 14% over the next 32 trading days.

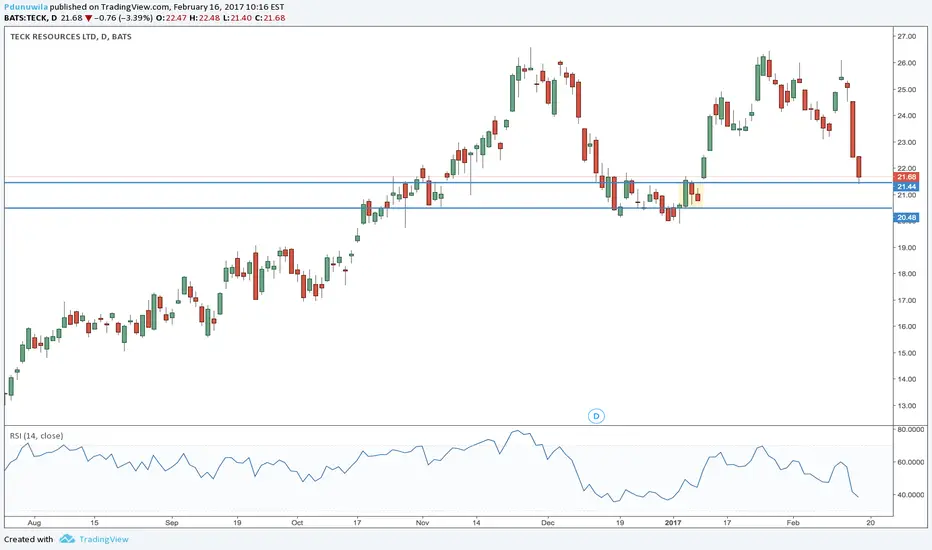
Teck Resources LTDBought the pullback to demand zone highlighted in yellow.
Entry: $21.44
Stop Loss: $20.44
Target 1: $22.44 (Take half position)
Target 2 $24.44