NGSUSD trade ideas

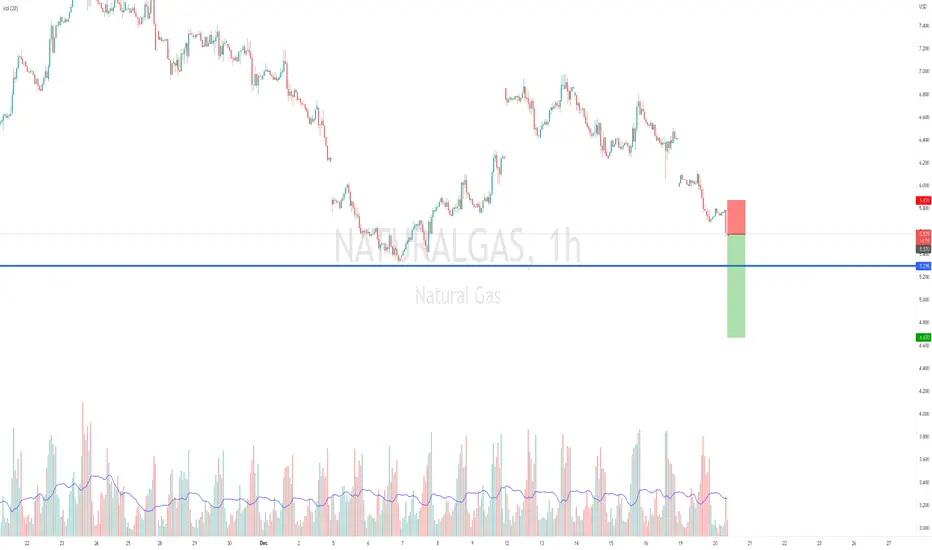
Going Short in Natural Gas Trade Indications:
1. Formation of Doji candle on daily showing no comfidence in the traders.
2 DOW theory HL & LL intact.
2. AB = CD pattern in formation.
3. Price at 61.8% FIb level support
4. AB=CD pattern intact
5. Natural Gas moderately bearish in December/ January
6. Bullish divergence on ST-Dev
7. Increase in seller volume.
Trade plan: Short / sell Trade
Entry point : Buy above the support zone @ 5.240 with bullish candle.
Stop Loss @ 5.560
Take profit - 1 @ 4.980
Take profit - 2 @ 4.770
Secondray Trade Buy / Long
If the AB=CD pattern succeeded and price value bounces from 4.750 , then place a long trade.
Entry price @ 4.820
Stop Loss @ 4.750
TP - 1 @ 4.990
TP - 2 @ 5.500
Regards.

Natural gas short viewShort in nature gas because Europe not buying natural gas at High price same thing are doing crude oil by Europe

Natural Gas - Accumulation Phase before next move?Moving into winter 2022 and the price of gas (regardless of inflation) is STILL running high. Average price looks to be around $3, so even allowing for inflation in the price we could still be seeing a preparation for another (not unusual) move down in price.
Looks like: Bear Flag
Next likely move: Break downwards
Where to: possibly down into mid $4

Natural Gas - Going into Christmas weekendIt looks like Natural Gas could find some support here. Might consolidate or it could have a nice bounce here depending on if it finds support. Also depends on the weather this weekend and supply as well.


Natural GasDouble Bottom on 4hrs Time Frame. A Bulleh Pattern . Expecting a new upmove till the trendline.

NAS IDEANatural gas target > 7.5$
Natural gas price repeated the positive closings above the moving average 55, to form additional support at 6.750 in order to confirm confining trades within the bullish track that appears on the chart.
Stochastic attempt to provide the positive momentum will assist to reinforce the chances of recoding many positive targets that might start at 7.200 and 7.650.
The expected trading range for today is between 6.800 and 7.650

NATURAL GAS BEARISH OUTLOOKThe cold weather in US had done little to support a price rise of the Natural Gas, while the consumption was lower than predicted.
The price of the gas had broken its support at $5.3 and might be heading further down, testing prices of 4.25 in the next couple of days. In the opposite scenario the price might try to reach levels of $6.07
RSI and MACD both are supporting the bearish movement with MACD histogram below 0 line and RSI below the 50 neutral line.
Risk Disclosure: Trading Foreign Exchange (Forex) and Contracts of Difference (CFD's) carries a high level of risk. By registering and signing up, any client affirms their understanding of their own personal accountability for all transactions performed within their account and recognizes the risks associated with trading on such markets and on such sites. Furthermore, one understands that the company carries zero influence over transactions, markets, and trading signals, therefore, cannot be held liable nor guarantee any profits or losses.

Natural Gas Christmas GiftBig M small A pattern. Short Selling idea.
All details are on the chart.
Merry Christmas!!!

Natural Gas (NATGASUSD): Time to Grow?! 💨
Natural Gas dropped to a key weekly/daily demand zone one more time.
Chances will be high to see a pullback from that.
A bullish breakout of a falling parallel channel on 1H time frame confirms the strength of bulls.
Goals: 5.6 / 5.8
❤️If you have any questions, please, ask me in the comment section.
Please, support my work with like, thank you!❤️

Natural gas - Dec 20, 2022I think that the NG price may continue to head down for a little bit. It looks like it may push through this current support around $5.3 (although it may have some small support here) and then head even lower. You can see the price should find some support from an old trendline and price levels around $4.80. I'm looking at that area as a place where we could do a buy (swing trade) if it looks like it's getting support there and market conditions are right (weather/supply).

Natural Gas is looking for a pullbackNatural Gas had a huge drop, then a big bounce (3 day bar surge!). It looks like it has hit resitance again and may fall into that lower bear target area.

More Bearish FlagAfter this Monday's gap is filled, I expect Nattie to slide to 5.3 again to make a triple bottom. A smaller bearish flag has formed on the 4h.

NatGas threatening long term support levelsTrade Idea: Selling Naturalgas
Reasoning: Price action breaking lower and threatening long term support. Potential Head & Shoulders formation testing the neckline
Entry Level: 5.57
Take Profit Level: 4.67
Stop Loss: 5.87
Risk/Reward: 3:1
Disclaimer – Signal Centre. Please be reminded – you alone are responsible for your trading – both gains and losses. There is a very high degree of risk involved in trading. The technical analysis, like all indicators, strategies, columns, articles and other features accessible on/though this site is for informational purposes only and should not be construed as investment advice by you. Your use of the technical analysis, as would also your use of all mentioned indicators, strategies, columns, articles and all other features, is entirely at your own risk and it is your sole responsibility to evaluate the accuracy, completeness and usefulness (including suitability) of the information. You should assess the risk of any trade with your financial adviser and make your own independent decision(s) regarding any tradable products which may be the subject matter of the technical analysis or any of the said indicators, strategies, columns, articles and all other features.
Natural Gas to GrowIt seems NG has started a new impulse wave as it finished C move down in late October. The momentum in price sees a higher low, and a potential for a bullish continuation should see a test of $7.1 resistance level. Major resistance is seen at $9.7.
I see energy as the ONLY short-medium term gainer. NASDAQ has been underperforming greatly in the index range, and will probably continue to see lower demand as earnings have been disappointing, and Fed's tightening policy continues.

NATGAS - 4HIn the four-hour time frame, we are in a bearish shoulder pattern. If we break the $6 zone, we will move to $4.

NAT GAS BREAKDOWNBreaking down bullish and bearish scenarios
Right now we LEAN bearish until we can close above the breakout line, though as we test it were neutral

Don’t they say nat. gas goes up in the winter, not this time!Supply and demand hahaha. More like inflation to deflation I will not be surprised when natural gas is back to $1.50

InvestMate| Naturalgas Is Getting More Expensive🏭 🏭 Naturalgas is getting more expensive
🏭 Observing the behaviour of gas in the last few days, I come to the conclusion that the medium-term uptrend is not over yet.
🏭 As you can see gas has been in accumulation since the end of October.
🏭 But in recent weeks something like the next upward wave is building.
🏭 After today's 7.86% rise, further increases are not at all unlikely.
🏭 The nearest zone of resistance is around a cluster of two fibo levels. The first is 0.786 of the last major downward wave. The second is 1.618 of the last local downward wave.
🏭 The support zone is determined by the cluster of the 0.236 and 0.382 levels of the last downward wave.
🏭 Also noting that we have pierced the 50-period moving candle and the MACD and RSI are generating signals towards the continuation of the current uptrend.
🏭 We have no choice but to observe how the price will behave.
🏭 The scenario I'm playing out is a continuation of the uptrend to the designated resistance zone. I'm aware of the possibility of a correction at any time, this should be taken into account, If the outlook changes I will publish a post with an update, so I encourage you to actively follow the profile and read the description carefully.
🚀If you appreciate my work and effort put into this post then I encourage you to leave a like and give a follow on my profile.🚀

NATGAS UpdateAs previously posted I closed my short position a few units before the gap was closed for NG. (see my previous post)
I waited to see if price will go any further downwards, but price keeps getting rejected around the gap.
I opened a long position after seeing the price get rejected again (see illustration).
Chart seems to be forming an IHS or Cup handle.
Entry points are Entry 1 (current price) or Entry 2 after a pull back
I see further upside to my TP1 and/or TP2 if lucky.
I am letting my position run with SL to BE and see where this goes.
Thank you. GL.

NATGAS ThoughtsI am leaning towards a close of the gap left on around 6.15-6.2 before moving further to the upside.
I executed my entry after the price broke the uptrend channel on 3min.
I am placing my TP - on the gap with trailing SL.
I will provide an update once the gap closes.

