Natural Gas about to blow!Nat gas has been a monster breakout trade.
Our members were positioned well on the long side and have officially closed everything out.
We are now looking for an arbitrage short opportunity.
We do except nat gas to go higher but price gains need to be digested.
NGSUSD trade ideas

Natural Gas: the monster tradeNAtural gas has broken out of a powerful base.
We have seen some stellar price action over the last couple weeks.
A short squeeze in the making could be brewing.
s we approach some heavy daily and weekly resistance, you may see some profit taking ahead of the next leg up.
The daily 200 MA & weekly 50 MA should be respected until they're broken.

Natgas Crab Is Still Freezingthe detail is shown in the above Idea.
I made this Idea based on Candlestick Analysis and Harmonic pattern.
We are still in a downtrend and probably we see a significant decline toward the Crab support line in the Next Weeks.
GOOD Luck
Idea number #103

Watch Out for Natural Gas PullbackSince February, the price of natural gas has increased by more than 50%. It seems plausible that this upward trend will not continue at this pace, especially with the warmer season approaching. Seasonally, it's worth noting that natural gas often experiences cyclical highs in the spring, which are rarely sustainable. Based on this premise, supported by technical signals such as a clear bearish divergence in the hourly to four-hour time frames, we are initiating the short trade shown here with an acceptable risk-reward ratio of around 1.5:1.

NATGAS LONG After recent massive bearish rally , Market formed a double bottom on weekly with bullish div
seems like the price may go for another leg higher.
Entry 1.746
SL 1.510
TP1 1.990
TP2 2.226

NATURAL GAS - Important Breakout 🚀
Previously, The Natural Gas Formed a Bullish Falling Wedge Pattern.
On Monday 6 May The Price Broke The Resistance Level (1.973 - 1.893).
Currently, This Key Level is Broken and Becomes a New Support Level !
So, I Expect a Bullish Move 📈
---------------
TARGET: 2.140🎯

25% Bullish Move for NATTY?Natty has reached the lows of Feb - 23 and has retested with some bullish intent.
There's also Bullish Divergence on various timeframes inc. Daily, 4hr, 2hr, 1hr as well as a Monthly on if it holds at these levels for a couple of months, from which we could see a major move up.
Taking the 0.618 fib levels as TP which also retest a previous support level.
Following this bullish move I expect at least a double bottom before going back up again.

Breakout from trendline. Upwards now 👊
Breakout from trendline. Upwards now 👊
We have mapped upside price targets in case the resistance lines are broken. If price gets rejected at the resistance line then price is expected to retrace back to the breakout point and then bounce back up
If it holds we have expect price to bounce towards upper resistance lines and ascending Fib price targets.
Are you buying?

NATYY Bullish H&S StructureQuite clear H&S shoulder pattern has developed on NATTY which began accumulating at the beginning of March of this year.
The green rectangle is the base of the massive accumulation zone which has acted as support previously, now turned resistance.
There's been 2 prior attempts at breaking through, on the third, it broke but wasn't able to hold.
The target is c15% increase in price and also takes us to the gap on 22nd Jan - this was calculated using the distance between the top and bottom of the cup.
GOOD LUCK!

NATGAS BuyNatgas is again approaching the usual support level around 1.613.
I think we can't go any lower than that, so it might be worth taking a long position.
The lowest possible can be 1,566.

NATURALGAS - Blow Off PhaseNATURALGAS
Pumping today but its coming out of a long ascending channel.
So this is wild and dangerous.
It has again pushed through resistance into the higher liquidity area.
At some point it will likely collapse either to a Golden Window retracement or lower low 👍.
Not shorting.
Not advice

Simple and cleanThe current chart pattern perfectly fitting under "Bear Flag". Let's see how it works out

Natural Gas still coiling! breakdown or breakout?Hello Traders
In This Chart NATGAS HOURLY Forex Forecast By FOREX PLANET
today NATGAS analysis 👆
🟢This Chart includes_ (NATGAS market update)
🟢What is The Next Opportunity on NATGAS Market
🟢how to Enter to the Valid Entry With Assurance Profit
This CHART is For Trader's that Want to Improve Their Technical Analysis Skills and Their Trading By Understanding How To Analyze The Market Using Multiple Timeframes and Understanding The Bigger Picture on the Charts

NATURAL CallsLooks like Natural Gas is trending in a channel and just landed on the its support area. Theres a high probability the price will reverse from this area as its been consolidating there for quite some time now.

My view on NG I can see some downtrend after hitting below 1.900 good for shorts
and I can see some good upward movement after hitting 2.55 to 2.7 would be great range for longs
Above mentioned views for purely positional trades

NGas is BullishI am expecting a continuation according to HTF and a high propability of a bullish movement after mitigating the FVG .
Happy trading.

Natural Gas LONG TERM Buying TRADE analysisHello Traders
In This Chart NATGAS HOURLY Forex Forecast By FOREX PLANET
today NATGAS analysis 👆
🟢This Chart includes_ (NATGAS market update)
🟢What is The Next Opportunity on NATGAS Market
🟢how to Enter to the Valid Entry With Assurance Profit
This CHART is For Trader's that Want to Improve Their Technical Analysis Skills and Their Trading By Understanding How To Analyze The Market Using Multiple Timeframes and Understanding The Bigger Picture on the Charts


Natural Gas April 22, 2024: Waiting to Break Above the ResistancOn April 22, 2024, CAPITALCOM:NATURALGAS is trading below the resistance of 2.04 - 2.05 (yellow line) from Feb 6, 2024, with 3 bottoms forming as shown on the chart.
A break above this resistance would trigger a buy signal with the target around 2.45 as shown on the chart, the same distance to the resistance as the from first bottom.

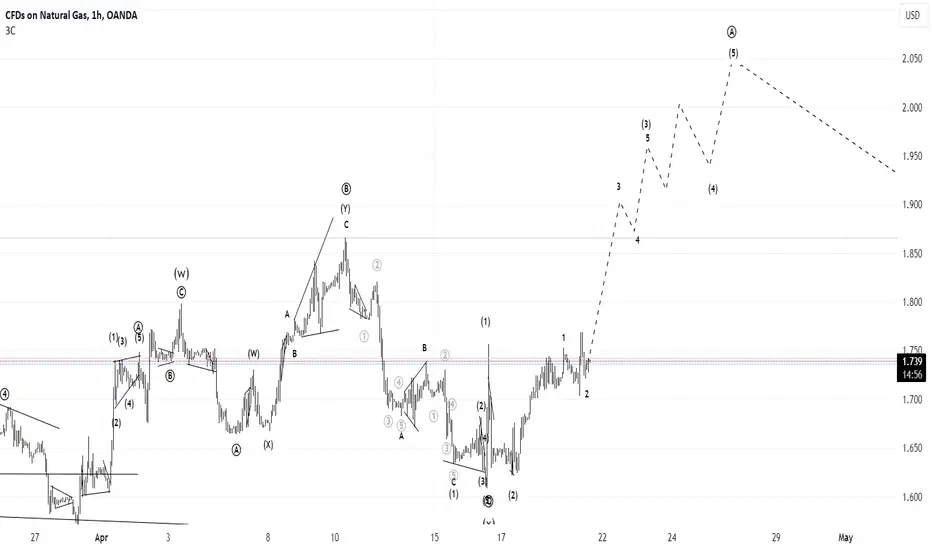
Maturity of the bullish market, any correction pattern extends tEsteemed analysts and traders,
I hope this correspondence finds you in good health and high spirits, prepared to tackle the upcoming week with renewed energy. I extend my best wishes for your continued success in all your business endeavors. It is worth noting that success in trading is largely dependent on the consistent definition and adherence to one's own rules.
As a supporter of the Elliott Wave Principle, I consider this methodology an invaluable tool for market analysis. After three years of personal experience, I have developed my approach by combining this principle with meticulous consideration of different market scenarios. I strive to avoid market surprises by maintaining a range of market prospects, which enables me to recognize the market structure forming with 100% accuracy.
I am pleased to share my analysis with you, with the caveat that I do not provide buy or sell signals. My perspective on idea analysis is entirely impartial, and if my analysis meets your standards, it may serve as a guide to making an informed decision.
For your reference and comparison, I have attached my previous analysis of the same market. All the details of my analysis are clearly labeled for ease of comprehension. Nonetheless, familiarity with the Elliott Wave Principle theory would facilitate an understanding of the analytical idea.
My study of the Elliott Wave Principle took nearly three years, during which my understanding and experience with this invaluable tool have grown. My progress thus far is a testament to the legacy of Ralph Nelson Eliot, whose genius has provided the foundation for my achievements. May he rest in peace.
I express my gratitude for your continued support and kindness, and welcome your comments and critiques.
May my analysis be a valuable asset to your business journey, and I remain sincerely yours,
Mr. Nobody

Natural gas long viewThe price of gas is moving away from the previous bearish trend. January and February were extremely bearish. March was a month of consolidation, and April initiated a bullish consolidation supported by EMA20 and EMA50 daily. The price is currently at the $2.05 level, and before the next bullish run, a pullback to the $1.95 support zone is possible.

Natural Gas LONG TERM selling TRADE analysisHello Traders
In This Chart NATGAS HOURLY Forex Forecast By FOREX PLANET
today NATGAS analysis 👆
🟢This Chart includes_ (NATGAS market update)
🟢What is The Next Opportunity on NATGAS Market
🟢how to Enter to the Valid Entry With Assurance Profit
This CHART is For Trader's that Want to Improve Their Technical Analysis Skills and Their Trading By Understanding How To Analyze The Market Using Multiple Timeframes and Understanding The Bigger Picture on the Charts

Natgas UpdateSeems like natural gas is ready to explode in 3rd of 3rd Elliottwave. Oil has similar sentiment despite being less obviously bullish. Natural Gas remains so far firmly on track and expected to rise with oil, perhaps on the Middle East escalation in the most nearest future.