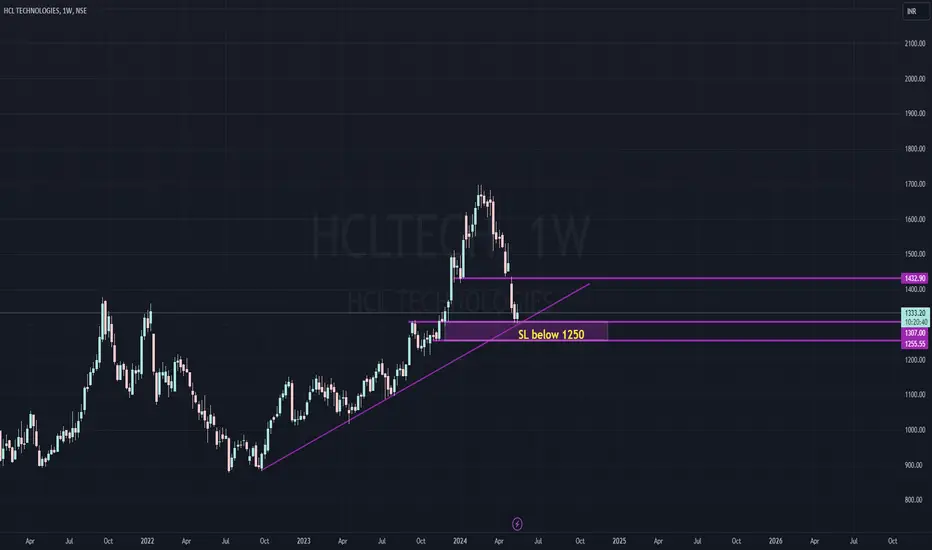
HCLTECH - ON WEEKLY TRENDLINEPossibility of a double bottom at 1300 seems likely... Looks good to accumulate in small quantities with a stop below 1250
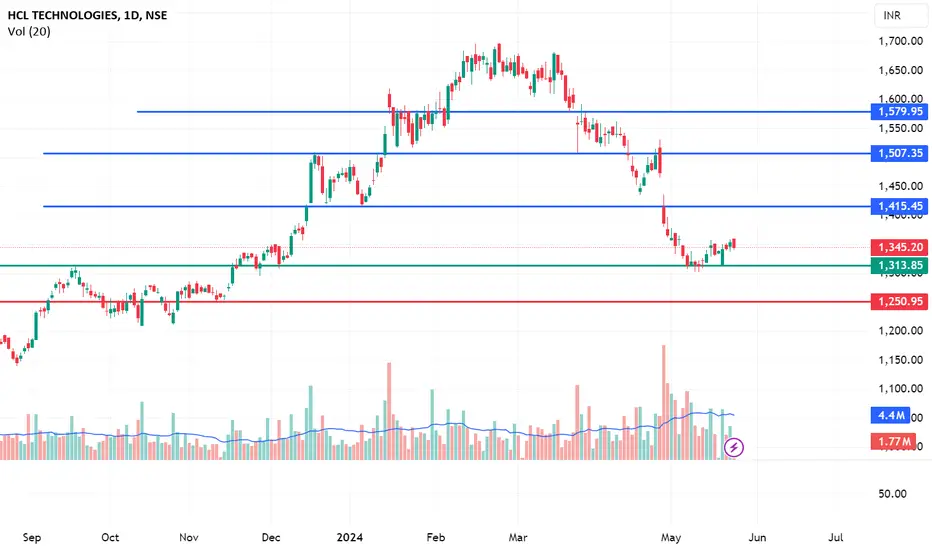
Likely to bounce till 1460. Upon further consolidation, can head higher to 1600+ lvls
HCLTECH trade ideas
HCLTECHNSE:HCLTECH
Good Stock of IT Sector
HCL Technologies (HCLT) reported weak Q4 performance with 0.3% QoQ CC consolidated revenue growth.
Support- 1313-1300
sl- 1250
Target- 1365/1415/1507/1579
Rsi >40 oversold zone
Good for Accumalate and will give good return in Mid term
HCL TECH Buy ( Demand zone confluence with Fibbonacci)HCLTECH is approaching demand zone which has a confluence with 50% of Fibonacci. Time to go long.

Time to cover short in HCL Tech?
After fall of around 20% , downswing in HCLTech seems to be over. I think it is time to cover short and initiate fresh long position.

Hcl tech : breakout of Rounding bottom and Retesting the baselinTech company showing some investors interest after smart fall.
Hcl would be good and safe investment out of them.
It is showing a formation of Rounding bottom and now Retesting the base line after breakout and rally of 20%.
Now do start investing and accumulation at this level for the target of 1700/1800/1900.
Healthy averaging would be considered at 1200-1250.
Time frame:6-9 months

HCL STOCK BUYING TIMEthis is my personal view hcl tech stock previously formed rounding pattern and breakout . Now it has retest clearly.

HCLTECH LongHCLTECH is at demand zone, can be accumulated between 1300 to 1330 for short term target of 1440

HCLTECH Looking Good...Buy HCLTECH at 1350 and all dips
Target1 - 1510
Target2 - 1690
Target3 - 1960 (if closing above 1690)
Disclaimer :-
I am not SEBI registered. The information provided here is for education purposes only.
I will not be responsible for any of your profit/loss with this channel suggestions.
Consult your financial advisor before taking any decisions

HCL: To break or not to break? ️🩹Here are some pointers for HCL:
- HCL recently broke its range and the final resistance trendline.
- The breakout was quite close to a resistance zone. A bearish engulfing prompted selling, but retest and continuation potential remains.
- A retest candle with a long lower wick signifies bullish sentiment. Notice the price sustained over the trendline.
- Your support means a lot to us. Do consider boosting this Idea.
- A Sustained close above the resistance zone can pave the way for HCL's upward movement.
- Also, the Indian IT sector is approaching its critical resistance for the third time. (link in the comment section)
Caution: When the bull runs, everything seems Green. Being cautious always pays well. Remember, you will be buying the top.
Don't let the analysis end here! Boost, comment, and follow for more such insightful posts.
⚠️Disclaimer: We are not registered advisors. The views expressed here are merely personal opinions. Irrespective of the language used, Nothing mentioned here should be considered as advice or recommendation. Please consult with your financial advisors before making any investment decisions. Like everybody else, we too can be wrong at times ✌🏻

HCL TECHNOLOGIES S/R Support and Resistance Levels: In technical analysis, support and resistance levels are significant price levels where buying or selling interest tends to be strong. They are identified based on previous price levels where the price has shown a tendency to reverse or find support.
Support levels are represented by the green line and green shade, indicating areas where buying interest may emerge to prevent further price decline.
Resistance levels are represented by the red line and red shade, indicating areas where selling pressure may arise to prevent further price increases. Traders often consider these levels as potential buying or selling opportunities.
Breakouts: Breakouts occur when the price convincingly moves above a resistance level (red shade) or below a support level (green shade). A bullish breakout above resistance suggests the potential for further price increases, while a bearish breakout below support suggests the potential for further price declines. Traders pay attention to these breakout signals as they may indicate the start of a new trend or significant price movement.
Disclosure: I am not SEBI registered. The information provided here is for learning purposes only and should not be interpreted as financial advice. It is important to consult with a qualified financial advisor before making any investment decisions. Tweets neither advice nor endorsement.
HCL near its short term bottom?
It seems HCL is near its short term bottom. It has already gone down by around 15% from its last high. I see maximum 3-4% downside after which it should start its upswing again. Should we buy tomorrow or wait for couple of days more and take long position on Monday? Please share your views.

Symmetrical Triangle pattern breakout in HCLHCL TECHNOLOGIES LTD
Key highlights: 💡⚡
✅On 1 Hour Time Frame Stock Showing Breakout of Symmetrical Triangle Pattern.
✅Strong Bullish Candlestick Form on this timeframe.
✅It can give movement up to the Breakout target of 1610+.
✅Can Go Long in this Stock by placing a stop loss below 1530-.

HCL Cup and Handle Breakdown !!!Hello All,
The recommendations are purely for educational purpose only, consult you financial advisor before trading.
Targets are mentioned in charts (either red lines or balck lines), keep Stop Loss as per your risk..
If you like my Idea, Don't forget to Boost and comment on my Analysis..
Have a profitable year ahead
Gautam Khanna
Technical Analyst by Passion :-)

HCLTECH--Rally base rally or Manipulation
This stock is now in consolidation
we have a strong support lies lies at 1580 range...
we have a rally base rally chance in this stock.
if price manipulation happens...to downside price distribution will observe to topside as well.
indicating bullishness in this stock price.
keep in long side from support levels.
case1::
case 2::
case 3::

HCL TECHFOLLOWING THIS TRENDLINE IN DAILY AND 4HR CHART you can target for intraday trade and swing bet also. As IT is in flaour

Time to long HCL tech maybeTime for this stock to move a bit high now. Once the resistance is broken I will double my investment around 1130 ish. Wish me luck :)

Uptrend Channel pattern breakout in HCLTECHHCL TECHNOLOGIES LTD
Key highlights: 💡⚡
✅On 1Hour Time Frame Stock Showing Breakout of Uptrend Channel Pattern.
✅Strong Bullish Candlestick Form on this timeframe.
✅It can give movement up to the Breakout target of 1660+.
✅Can Go Long in this stock by placing a stop loss below 1595-.

HCLTech Result view cmp 1224HCLTech Result view cmp 1224
trading at daily support
upper side 1275 - 1285
High possibilities to break 52week high positionally

New Journey for HCLTECH ?Stock gave perfect retest after breakout on a WEEKLY chart : Also stock has posted massive results which will result in upmove .
Entry - cmp or 1469
SL - your risk ( max - 5% )
Target - 1628, 1783
-- DISCLAIMER --
I am not a financial advisor or SEBI registered.
This is just a view.
Please DO YOUR OWN RESEARCH before investing in any stock.
Happy trading.
Peace.

Hcl tech very strong for upcoing daysHcl tech 2nd time recomdation for long side possible target will come for 1450-1500 invalid below 1248

HCLTECH BREAKOUT We have a breakout in HCLTECH, Volume looks too good here with 1510 as a stop loss on daily one can go long with targets of 1550/1580/1600.

HCL TECH HOURLY STOCK TO BUYHCL TECH is in positive territory
its a stock to go long above the levels of 1147 on hourly closing
target levels marked on the chart with the black highlight &
invalid zone is 1435

HCL TECH ( READY TO FIRE)All time high break out and ready to fire to stock. Followed by awsome volume. and key moving averages.
sl 1308
