IDFCFIRST BREAKOUTRange breakout, Bullish, accumulate on dips or current level for the target of 33.
IDFCFIRSTB trade ideas

IDFC FIRST_LONG*broken 2.5 month long channel
*tested last support & closes positive with good volume
*looks good for target price of 37


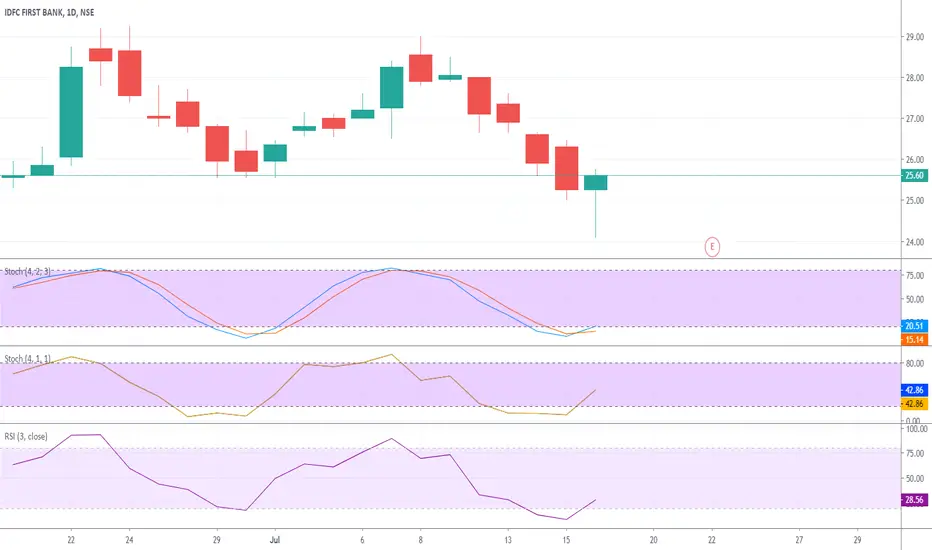
IDFCFIRST BANKNSE:IDFCFIRSTB
IT HAS CLEARED OFF THE RESISTANCE OF 29.25 AND IS CLOSED ABOVE THAT
WITH 29.25 AS STOP LOSS IT CAN BE PLAYED FOR 32.50 AND BEYOND THAT 34.50
TRAIL STOP LOSS
******************************************************************************************************************************************************************
Hi all,
Its pleasure to have you all here.
I have started putting these charts as a contribution from my side to all people who are new to business, as I had to struggle a lot without any sources at disposal. So please consider this a just small contribution from my side.
Few Honest Disclosures:
1. Any idea shared is my personal view, its not a recommendation, neither any kind of paid propaganda, so please
do your bit of research.
2. Ideas shared does not mean that I trade all or have position in them, this is just a helping hand to all.
3. I expect no comments or like nor any negativity, as I said its just a small helping hand from my side, please plan your risk and trade as per your capacity.
4. To trade in Cash, options or futures is your sole choice and your own risk
5. I am no expert in Tech Indicators, I believe in support resistance and trendline theory, you may use this as a supplement theory for better results.
6. I work for my own living, this is a hobby which I do sincerely to help anyone who might come across my charts.
***********************************************************************************************************************************************

Swing Trade in IDFC First BankIDFC First bank formed ascending triangle pattern also revers head & shoulder pattern in it....we can look for breakout of both the pattern.

Short term Target 2 wksIt has formed a perfect Inverse Head And Shoulder Pattern. As per the length from the top of the head to Neckline the measured target is 34 in 2 weeks.
as long as it stays above 28.90 (Neckline) which is also your stop loss.
DONT MISS.


IDFC BANK may be POSITIVE on Monday(it is only a assumption, everyone have different view of chart reading.)
Thanks


#IDFCfirst - same like #ICICIbuy to sell just like ICICI, possible triangle, doublebottom & bearish bat forming


Possible Rebound (IDFC First)Double Bottom, a tiny one has formed, also there is a teeny tiny divergence in RSI.
Also, the ratio of Price of IDFC First Bank to Nifty has double Bottom.
Seeing a possible rebound amid Covid-19. But it is unlikely because banking sector has been hit hard.
While the quarterly report can be a booster shot for the IDFC First Bank.

## Chart learning ## Bear channel IDFC first bank following long term bear channel in weekly chart. now reversing from the bottom of the channel with strong weekly closing.

IDFCFIRSTB - OPPORTUNITY OF 300% RETURNS IN 2 MONTHSIDFCFIRSTB - OPPORTUNITY OF 300% RETURNS IN 2 MONTHS
BUY @ 14.65 WITH A SL OF 12.15 AND A TARGET OF 41.65. TARGET SHOULD BE ACHIEVED BY MAY-END 2020

Is it a Bullish Sign ?On daily time frame it opened below 60 EMA and Closed above 20 EMA
which is a sign of BULLISH, hope to go upside in a few sessions
I am just a learner and not a professional trader, based on my view
please don't trade, verify at your end before enter into this counter

IDFC FIRST BANK LONG TRADEStock stabilising near support and beginning an uptrend.Buy once it breaks the yellow line upwards.Keep SL of 41.90


IDFCFIRSTB, Trade Idea on Basis of Wave Structure...As per the Last Development (Wave Structure) we are 'Bullish' with Invalidation Level at 37.50.
On the Higher side, we can expect 52.50 Level at an Initial stage...


IDFCFirstB - Breakout trade from a Falling Wedge PatternIDFCFirstB seems to be forming a Falling Wedge Pattern in the Daily charts. A break above 43 could signal a breakout on the upside. Could see upside towards 48-50 band. A fall below 37 could negate the pattern.

Go long on IDFC First BankAfter a long time day candle has closed above the 50 DMA. Sentimental RSI indicator is also green .This looks bullish set up. I would keep a stoploss near 39.50 - 40. My near term target would be 50.
Happy Trading and Investing!!!
