SAIL LONG TRADE 1 HOURHello TradingView community and my followers, please if you like the ideas, don't forget to support them with likes and comments, thank you very much and here we go.
.
SAIL
1 hour : It has taken the liquidity from demand zone.
*Wait for the opportunity in lower timeframe (5 min) and we could see an upside movement.
THANK YOU !!!!
SAIL trade ideas

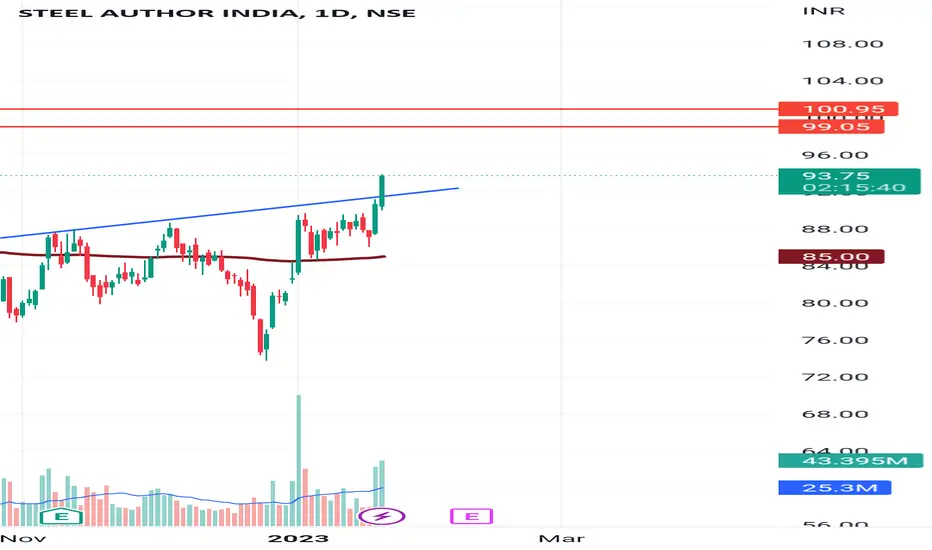
SAIL SWING TRADESail have broke the resistance and also retested its previous resistance which is its support now, SAIL might be a good swing trade.

Sail Buy sail at cmp 93
Sl 87
Tgt 96 98 100+
Ask your financial advisor before buying
Only for educational purposes
Short term call
Go UpGoing With Rocket 100 and otherr things will be now on trend line up price so thag can be buy opportunity so go and buy target 100

Metal Stock In RadarToday stock broke out from “inverted head and shoulder” pattern.
🌁Metals are outperforming, also brokerages gave strong upgrade in metal sector today.

SAIL Swing Trade OpportunitySAIL is about to give a breakout
89.30 to 90 is a strong resistance if it manages to break and sustain above this level we will get good swing trade.
There is a pivot as well at 89.55 very simple trade plan. If it breaks those important level then we can go long in SAIL Intraday or swing.
For more refer to the image above
Comment If you have any questions or queries.
Happy Trading !

sail breakout sail long term breakout as per my analysis steel industry continue upside this months due budget coming we see good move after infrastructure budget positive

A very long term perspectiveOn the left side wave 1 completes and wave 2 took almost 8~10 years to complete and now wave 3 just started let's see how for it goes in time as well as range

It May give Big move in very Short TermAfter Breakup of trendline , first Target would be 95+
Guys its my opinion , before Investment do your own study .

THIS IS SAIL IDEA FOR TRADINGCHART showing some strength RSI is crossing the 60 levels on the day chart
forming a rising wedge and higher low.
as you can see 20ema is crossing 50ema from down to an upward direction bullish crossover
EDUCATIONAL PURPOSE ONLY!


#SAIL #TATASTEEL #HINDALCO #TATASTLLP #JINDALSAW #JSL #JSLHISAR #SAIL
NSE: SAIL
CMP: 80
TP: 93
SL: 74
TF: <6m
RR > ~2 times
Return > 15%
JSWSTEEL JINDALSTEL SAIL NATIONALUM TATASTEEL HINDALCO TATASTLLP JINDALSAW JSL JSLHISAR JINDWORLD JINDRILL JINDALPHOT JINDALPOLY VEDL
Factors:
BULLISH WEDGE BREAKOUT
Trend Following
Rising Volume with rising Prices.
Flag pattern breakout.
Pennant Pattern Breakout with Bullish Candle.
Retest Successful.
Higher Highs & Higher Lows.
Broken above RESISTANCE levels
Trading at SUPPORT levels
Earnings are strong.
Bullish Wedge Breakout
Risk Return Ratio is healthy.
And
Rising from Double Bottom Pattern to Flag Pattern forming.
If you like my work KINDLY LIKE SHARE & FOLLOW this page for free Stock Recommendations.
With 💚 from Rachit Sethia

SAIL - LOOKING GOOD LONG #APOLLOHOSP... ✅
INTRADAY/ Short term delivery call as well
All levels given in charts
IF good potential seen then we work in options also
if activate then possible a huge movement Keep eye on this
We take trade only when it activates...
Possible to give good target

SAIL LONGsail triggered buy in our trading system(thetrenraider)
chart pattern and price action in bullish
all levels shared for education purpose.we are not sebi registered


SAIL has a target of 129stock is heading up to 129 level...which is the confluence of yellow trend line, blue channel top and R1 PP...

SAIL Buy for intraday tradingSAIL Buy for intraday trading if stock break the given resistance level..........


SAIL - Demand emerged near 60 in Jul'22This was after 7x up from 18 (Mar'20) to 135 (May'21)
Note: history of 90% drop from 210 (Dec'07) to 18 (Mar'20)
Plan ahead => could consider to Buy above 110
- and/ or Rejections near 65
PB 0.6x
PE 8x
DE 0.6x
ROCE 21%
DivYld 10%


Sail is on major point.Steel Tailwind & Sail is my priority, 83 is major resistance & above 88 is blast, Below 80 is neglect this trade, Happy Trading.

Sail Elliott Wave Analysis in TamilSAIL good for Swing Target
next Target 0.618 118 next Target..watch trend line swing Levels
