Critical Levels to Watch in ASILook at Blue areas and Fib Levels.
Strong Support Level - 7700 ( ASI should protect this level )
ASI trade ideas

ASI - Falling Wedge Pattern in CSEASI might bounce from 8500 level. Closely monitor this falling wedge pattern and fib levels in the chart.
Disclaimer : The information and analysis provided in this publication are for educational purposes only and should not be construed as financial advice or recommendations to buy, sell, or hold any securities. The author and TradingView are not responsible for any investment decisions made based on the content presented herein. Always consult a financial professional before making any investment decisions.

ASI - All Share IndexDisclaimer: This chart and analysis are not meant to be, and do not constitute, financial, investment, trading, or other types of advice or recommendations. Do your own due diligence before trading or investing in any stock exchanges, Indices, Stocks, Forex, Crypto etc.
CSELK:ASI
ASI
The index didn't manage to break through the resistance of 9300 - 9350 . This is a GP rejection on FIB.
The day closed with a shooting star candle pattern.
There is a bearish divergence created.
A DEATH CROSS scenario is there where the MA 50 has crossed the MA 200 in a declining phase. But at the moment the both MAs are flattened out.
There will be an immediate support from the rend line created by the most recent HH points.

ASI - All Share IndexDisclaimer: This chart and analysis are not meant to be, and do not constitute, financial, investment, trading, or other types of advice or recommendations. Do your own due diligence before trading or investing in any stock exchanges, Indices, Stocks, Forex, Crypto etc.
CSELK:ASI
ASI
The index came down for the third day and closed above the support zone 9150-9100.
This area might be the potential area where a HL point can be created.
The trend line from current and last HH points now can act as a resistance which is near to the next resistance zone.

CSE - ASI 6/19After recent breakout bourse took a breather after getting rejected at golden pocket fib level.
currently its nearing the support zone roughly at 9150 range.. expecting a bounce here while forming another HH and HL formation. Failure to that pullback could extend to 9030 levels.
lets watch!

ASI - All Share IndexDisclaimer: This chart and analysis are not meant to be, and do not constitute, financial, investment, trading, or other types of advice or recommendations. Do your own due diligence before trading or investing in any stock exchanges, Indices, Stocks, Forex, Crypto etc.
CSELK:ASI
ASI
ASI closed with a red candle. This scenario might create a HH point while the marked yellow zone and above it can be the probable creation of HL point.
This will help out to cool down the RSI while traders can take some profits.
RSI is cooling down after reaching overbought zone.
MACD is maintaining above the base line.
In daily chart, MA 30 has started to incline and MA 50 which was in decline trend has started to flatten out. Eventually this will to incline towards up.

ASI - All Share IndexDisclaimer: This chart and analysis are not meant to be, and do not constitute, financial, investment, trading, or other types of advice or recommendations. Do your own due diligence before trading or investing in any stock exchanges, Indices, Stocks, Forex, Crypto etc.
CSELK:ASI
ASI
ASI closed leveling with thew previous day low. If this movement it future movement can create a High Low point it will be a very good indication for ASI and it can move to a High High situation.
If the HH can be created with in the resistance zone and making MA 50 (red line) as a resistance we can assume a testing has been done.
Also keep note that RSI has flattened and MACD is still in the negative zone.

ASI - All Share IndexDisclaimer: This chart and analysis are not meant to be, and do not constitute, financial, investment, trading, or other types of advice or recommendations. Do your own due diligence before trading or investing in any stock exchanges, Indices, Stocks, Forex, Crypto etc.
CSELK:ASI
ASI
ASI took resistance near the area of MA 30, resistance zone 8840-9000 lower range and closed with a green candle.
Both MACD and RSI looks positive.
A High low is an ideal setup at this current situation.

CSR - ASI 29/5once again we are at cross road.. ASI is adamant on testing the tight support zone once again..
Pluses +
possible triple bullish divergence and breakout retest of RSI
ASI in a falling wedge
Strong demand zone at 8500-8550 levels
long term daily trendline support
Negs -
Support being tested several times.
SMA50 is curving towards SMA200.
Next support being 7800 (major one)

ASI Bearish again! Where is the bottom?Next Strong Support Levels:
8600
8200
Disclaimer: The information and analysis provided in this publication are for educational purposes only and should not be construed as financial advice or recommendations to buy, sell, or hold any securities. The author and TradingView are not responsible for any investment decisions made based on the content presented herein. Always consult a financial professional before making any investment decisions.


CSE - ASI 21/5/23Market has been dull and showing bare minimum turnover for past couple of weeks. Indicating minimal interest of the investors. Usually happens when market bottoming out.
Technically lower trendline is where money lies. Quick touch there should bounce it at the support zone 8550 ~ 8520 roughly, with a possibility of making a RSI divergence.
Keep good eye on RSI trendline for a possible breakout.
DDR/DDO would play a major role as the trigger for next move in price action.
Holding the trendline from previous lows will be crucial for bulls. Below that we might see further pullback/correction/ or more..
NOT an IA

ASI - All Share IndexCSELK:ASI
Disclaimer: This chart and analysis are not meant to be, and do not constitute, financial, investment, trading, or other types of advice or recommendations. Do your own due diligence before trading or investing in any stock exchanges, Indices, Stocks, Forex, Crypto etc.
ASI Weekly
01. ASI index made a cup and handle in the weekly chart.
02. The supporting trend line is intact.
ASI on 12/05/2023
01. Index held above the MA 200 and MA 200 is currently providing support.
02. Index moving within the resistance zone.
03. MA 100 is going to be the next resistance but MA 100 is being flatted out. But MA 30 is sloping down and will be a strong resistance.
04 On the RSI, the bearish trend line has just been broken towards the upside. But with the last closing it shows indication of testing the trend line.

ASI - All Share IndexCSELK:ASI
Disclaimer: This chart and analysis are not meant to be, and do not constitute, financial, investment, trading, or other types of advice or recommendations. Do your own due diligence before trading or investing in any stock exchanges, Indices, Stocks, Forex, Crypto etc.
ASI on 12/05/2023
01. Index held above the MA 200 and MA 200 is currently providing support.
02. Index moving within the resistance zone.
03. MA 100 is going to be the next resistance but MA 100 is being flatted out. But MA 30 is sloping down and will be a strong resistance.
04 On the RSI, the bearish trend line has just been broken towards the upside. But with the last closing it shows indication of testing the trend line.

CSE - ASIASI is showing strength! RSI trendline has broken. 8500 support will work in case of pull back. if not immediate resistance will 9150.
Currently market is running on the support of 200dma. however its important to take position in cautions until we make a higher high, to break of the market structure, which is currently bearish.
However RSI breakout will work as a short term bullish signal. Lets see how it plays out

ASI - All Share IndexCSELK:ASI
Disclaimer: This chart and analysis are not meant to be, and do not constitute, financial, investment, trading, or other types of advice or recommendations. Do your own due diligence before trading or investing in any stock exchanges, Indices, Stocks, Forex, Crypto etc.
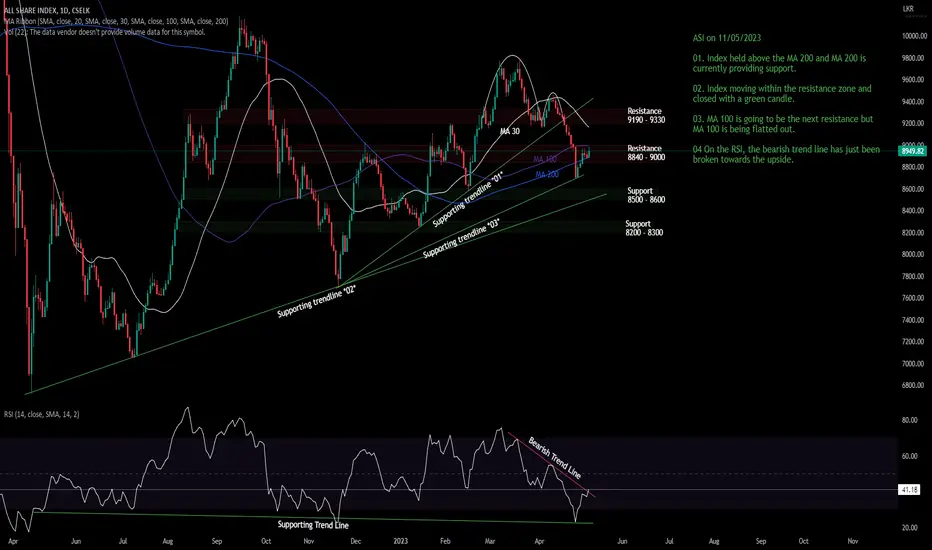
ASI on 11/05/2023
01. Index held above the MA 200 and MA 200 is currently providing support.
02. Index moving within the resistance zone and closed with a green candle.
03. MA 100 is going to be the next resistance but MA 100 is being flatted out.
04 On the RSI, the bearish trend line has just been broken towards the upside.
ASI - All Share IndexCSELK:ASI
Disclaimer: This chart and analysis are not meant to be, and do not constitute, financial, investment, trading, or other types of advice or recommendations. Do your own due diligence before trading or investing in any stock exchanges, Indices, Stocks, Forex, Crypto etc.
ASI on 08/05/2023
01. ASI is at the Current resistance zone 8840-9000 was tested and closed within it.
ASI on 08/05/2023
01. Index moved up for 3 consecutive days and currently testing and resting with in the resistance zone.
02. Index closed above the 200 MA.
03. RSI moved above the over sold zone and now moving towards the resistance trend line. A break out from this can be used as one indication.

ASI - All Share IndexCSELK:ASI
Disclaimer: This chart and analysis are not meant to be, and do not constitute, financial, investment, trading, or other types of advice or recommendations. Do your own due diligence before trading or investing in any stock exchanges, Indices, Stocks, Forex, Crypto etc.
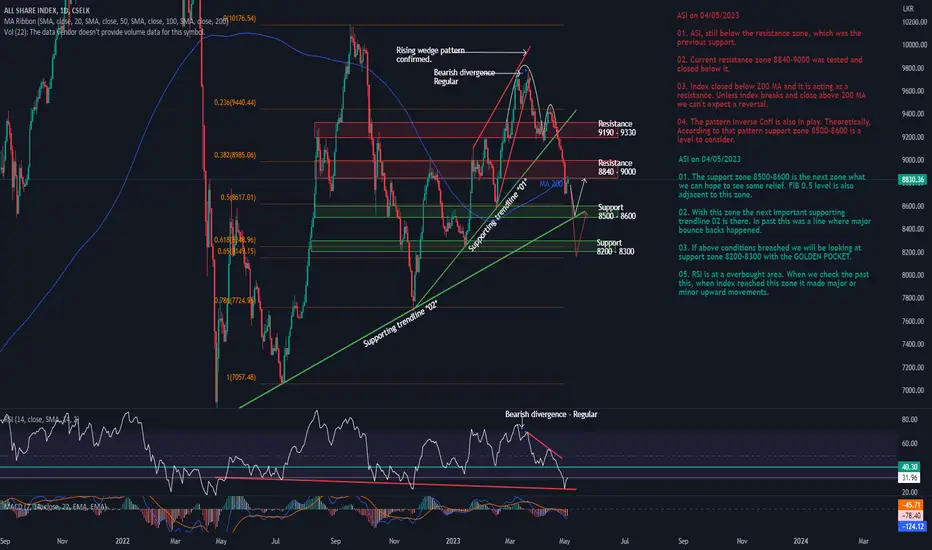
ASI on 04/05/2023
01. ASI, still below the resistance zone, which was the previous support.
02. Current resistance zone 8840-9000 was tested and closed below it.
03. Index closed below 200 MA and it is acting as a resistance. Unless index breaks and close above 200 MA we can't expect a reversal.
04. The pattern inverse CnH is also in play. Theoretically, According to that pattern support zone 8500-8600 is a level to consider.
ASI on 04/05/2023
01. The support zone 8500-8600 is the next zone what we can hope to see some relief. FIB 0.5 level is also adjacent to this zone.
02. With this zone the next important supporting trendline 02 is there. In past this was a line where major bounce backs happened.
03. If above conditions breached we will be looking at support zone 8200-8300 with the GOLDEN POCKET.
05. RSI is at a overbought area. When we check the past this, when index reached this zone it made major or minor upward movements.
ASI 060520231. ASI broken below MA 200 and retesting.
2. MA 50, 20, 9 aligned top to bottom
3. MA 100, 9 about to cross
4. RSI took trend line support
5. Low turnover is observed continuously
6. If failed to break MA 200 resistance possible to take support at trend line
8. It is important for ASI to break 9456 and settle above.

ASI - All Share Index[ b]Disclaimer: This chart and analysis are not meant to be, and do not constitute, financial, investment, trading, or other types of advice or recommendations. Do your own due diligence before trading or investing in any stock exchanges, Indices, Stocks, Forex, Crypto etc.
CSELK:ASI -
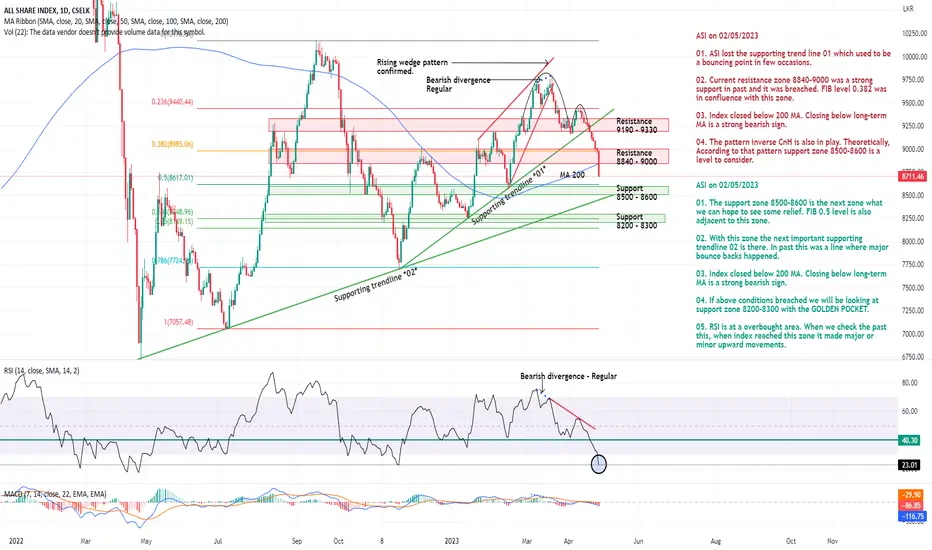
ASI on 02/05/2023
01. ASI lost the supporting trend line 01 which used to be a bouncing point in few occasions.
02. Current resistance zone 8840-9000 was a strong support in past and it was breached. FIB level 0.382 was in confluence with this zone.
03. Index closed below 200 MA. Closing below long-term MA is a strong bearish sign.
04. The pattern inverse CnH is also in play. Theoretically, According to that pattern support zone 8500-8600 is a level to consider.
ASI on 02/05/2023
01. The support zone 8500-8600 is the next zone what we can hope to see some relief. FIB 0.5 level is also adjacent to this zone.
02. With this zone the next important supporting trendline 02 is there. In past this was a line where major bounce backs happened.
03. Index closed below 200 MA. Closing below long-term MA is a strong bearish sign.
04. If above conditions breached we will be looking at support zone 8200-8300 with the GOLDEN POCKET.
05. RSI is at a overbought area. When we check the past this, when index reached this zone it made major or minor upward movements.
CSE ASI 5/2/2023ASI got a colossal 271 points drop today almost triggering circuit breakers today in bourse! This was the biggest single day drop ever since last year October 11th.
As expected from losing rising wedge trendline support market was showing diminished strength even though most of the fundamentals are coming in to place.
What to expect
* I strongly believe market should bounce hard from 8430-8500 levels. given the long standing trendline support lying there.
Pros.
* Market is properly oversold, green RSI region has only being pierced once in recent history. Covid era
* Fundamentals are flipping
* Interest rates are gradually coming down
* 0.5 Fib level
* Possible double bottom with a good support zone (marked in green)
Cons.
* DDR uncertainty.
* Dollar earning counters are at slight risk due to rupee appreciation
* Risk of losing dark green trendline. (further downtrend can be expected, though unlikely, there is a possibility
Not IA. just observations..

ASI - All Share IndexDisclaimer: This chart and analysis are not meant to be, and do not constitute, financial, investment, trading, or other types of advice or recommendations. Do your own due diligence before trading or investing in any stock exchanges, Indices, Stocks, Forex, Crypto etc.
ASI (Left Side)
01. On 17/04/2023 RSI trend line rejected.
02. The supporting trend line rejected. Support zone 9190-9330 rejected.
03. MA 20 crossed MA 50 towards the down side.
04. RSI in a decline.
ASI (Right Side)
Inverted Cup and handle pattern completed and the neck line lost the support.

ASI 21042022Currently forming a base at GP and trend line support. Needs to break the Gold colour trend line and settle above while protecting the trend support.
