CL1!: Long Signal Explained
CL1!
- Classic bullish formation
- Our team expects pullback
SUGGESTED TRADE:
Swing Trade
Long CL1!
Entry Level - 70.93
Stop Loss - 69.09
Take Profit - 73.70
Our Risk - 1%
❤️ Please, support our work with like & comment! ❤️
CLN2028 trade ideas

CRUDE OILPreferably suitable for scalping and accurate as long as you enter carefully the price behavior with the drawn areas.
With your likes and comments, you give me enough energy to provide the best analysis on an ongoing basis.
And if you needed any analysis that was not on the page, you can ask me with a comment or a personal message..
Enjoy Trading... ;)

WTI Light Sweet Crude Oil, 7/6/23For Thursday, 69.55 can contain session weakness, above which 72.80 remains a 2 - 3 day target able to contain buying into later week, and the point to settle above for yielding the more meaningful 77.20 within 1 - 2 more weeks.
Downside Thursday, closing below 69.55 signals another test of 67.08 within several days, able to contain weekly selling pressures and above which 77.20 is attainable over the next 3 - 5 weeks.
On the other hand, a daily settlement below 67.08 indicates 62.14 longer-term support within 2 - 3 weeks, where the broader market can bottom out through summer activity.

MCX : CRUDE OIL FUTURESMCX : CRUDE OIL FUTURES
Post hitting the target @ 5422 levels, Crude is forming a descending triangle.
A close below swing low of 5290, will drag down to next target @ 2818 levels.
Time to keep an eye.
It's only an observation & not any suggestion.

Crude realityI have a timid long on this one. I am not confident in it. But I really feel these are the forces that are at play here and if we enter the orange zone we might decide where this is going.

CRUDE OILPreferably suitable for scalping and accurate as long as you enter carefully the price behavior with the drawn areas.
With your likes and comments, you give me enough energy to provide the best analysis on an ongoing basis.
And if you needed any analysis that was not on the page, you can ask me with a comment or a personal message..
Enjoy Trading... ;)

big move for west oil is preparing to happen In the main structure, we are in an expansion triangle. Wave D of this triangle maybe is like this, and after that wave E has target above $200

CL BUY LIMIT POSITION this position based on the MCT STRATEGY and order block
Risk reward is 1:3
Entry: 70.88
Tp: 71.50
SL: 70.67
Good luck traders

Exploring Seasonality in Crude Oil PricesWhat rises, must fall. What comes down, goes up again. This rings most true for crude oil prices. Both secular and seasonal trends are at play in crude oil prices.
Demand for oil moves in tandem with global economic activities. Key secular trends impacting oil markets over this decade was covered in our previous paper . These range from falling demand from developed markets, and rising demand in emerging economies, among others.
While secular trends unravel over a longer time, seasonal cyclical effects can be observed over a short term.
This paper will explore consumption patterns driving annual seasonality in crude oil prices. In Part two of this paper, we will illustrate trading crude oil derivatives to harness opportunities arising from seasonality.
CRUDE OIL SUPPLY CHAIN: AN OVERVIEW
Gluts and shortages, economic growth and contractions, and geopolitics impact crude oil prices. Different events impact various segments of the supply chain. The global crude oil supply chain is complex and intricate. It can broadly be classified into Upstream, Midstream, and Downstream.
Upstream and midstream sectors drive crude oil supply. Upstream outage or shortage affects available supply which are sometimes evened out by the midstream through adequate inventories.
Downstream and midstream drives demand. End consumer demand is observed in distribution. Refineries adjust output based on their margins which in turn is derived from crude oil prices and refined product prices.
WHAT DRIVES SEASONALITY?
Seasonality in demand for refined products impact crude oil prices. Higher demand for refined products (gasoline, diesel, and kerosene) is observed in summer because of travel. While lower supply is caused by maintenance linked pauses in downstream during winter.
Crude oil inventory shifts can be segmented into four phases, namely: (1) Inventory Build Up (Feb - May), (2) Summer Travel Spikes Demand (Jun - Aug), (3) Demand Shrinks & Supply Contracts (Sep - Nov), and (4) Winter led demand spike (Dec - Jan).
This seasonality is evident in US crude oil inventory shifts as exhibited below.
Impact of seasonality is not always directly apparent or predictable. Why? Crude oil is so deeply intertwined with global economics. Shocks, if any, can have an outsized impact on prices and volatility. Also, supply cuts from majors oil producers and GDP shifts in major consumers have jumbo effect on prices. Consequently, other factors moderate or nullify impact of seasonality.
The below chart shows the average price behaviour of Crude oil from the start of each year over the past twenty (20) years by using CME front month crude oil futures price data from TradingView.
Orange bars in the above chart represents average monthly price change measured over last twenty years. Meanwhile, the white bar shows monthly price change for the same period but after excluding the outliers. Outlier years include 2008 (global financial-crisis), 2020 (pandemic), and 2022 (Russia-Ukraine conflict).
Crude prices go bullish on higher demand by refineries starting in March and continue to rise through the summer months as demand for refined products remains high driven chiefly by increased travel.
However, by August, sufficient refined product inventories dampen demand. With refineries slowing for maintenance, crude demand declines leading to a moderation in price. Finally, a small uptick is observed in December as demand starts to rise again during peak winter.
The average monthly returns for each month are displayed below. However, note that the standard deviation for these averages is non-trivial indicating that month-of-the-year effect on crude oil prices is uncertain and, in many cases, statistically insignificant. This conclusion is also arrived at based on various academic research papers.
METHODS TO HARNESS CRUDE OIL SEASONALITY
Three most common methods to harness gains from seasonality include: a. Futures (highest upside and highest downside), b. Call options (upside limited relative to futures and limited downside risk), and c. Call and/or Put Spreads (limited upside and limited downside).
Traders can deploy options to express a directional view with unlimited upside and limited downside. In a long options position, the downside is limited to the premium paid.
Conversely, a short position in options involves selling an option. This offers upside limited to the premium collected but exposed to unlimited downside.
TRADE SET UP ILLUSTRATIONS
From July until November, based on historical observations over the last twenty years, crude oil prices tend to fall. We could set up a trade using the December contract month of CME Micro Crude Oil Futures which expires on Nov 17th:
1. Short Futures: Short Futures position in MCL Dec 2023 contract (MCLZ3) at USD 70 per barrel with the anticipation that prices will fall by November.
2. Long Puts: Long Put options on MCLZ3 at a strike of USD 69 per barrel with a hypothetical options premium of USD 3 per barrel.
3. Bear Call Spread: Bear Call Spread with a net premium of USD 1 per barrel on MCLZ3 comprising of a short call option at a strike of USD 71 a barrel (collecting options premium of USD 5 per barrel) and a long call option at a strike of USD 73 a barrel (paying options premium of USD 4 per barrel).
The Bear Call Spread profits a fixed amount equal to the net premium when both options expire out of the money. When only the short call options expires in the money, the position loses by having to pay the options buyer. However, when both options expire in the money the profit from the long option partially offsets this loss resulting in a capped downside.
Each CME Micro Crude Oil Futures contract represents one hundred barrels of crude oil. Accordingly, the above three trade set ups are illustrated across various price scenarios as shown below.
Please note that these illustrations do not include (a) transaction costs comprising of exchange trading and clearing costs and brokerage fees, and (b) capital costs associated with margins required for establishing these positions.
MARKET DATA
CME Real-time Market Data helps identify trading set-ups and express market views better. If you have futures in your trading portfolio, you can check out on CME Group data plans available that suit your trading needs www.tradingview.com
DISCLAIMER
This case study is for educational purposes only and does not constitute investment recommendations or advice. Nor are they used to promote any specific products, or services.
Trading or investment ideas cited here are for illustration only, as an integral part of a case study to demonstrate the fundamental concepts in risk management or trading under the market scenarios being discussed. Please read the FULL DISCLAIMER the link to which is provided in our profile description.

CL BUY POSITION This position based on the MCT STRATEGY and order block
Risk reward is 1:3
Entry: 70.26
Close: 70.86
Good luck traders

CL Short Position This position based on the MCT STRATEGY and order block
The details of tge position is:
Risk reward is 1:3
Entry in 70.20
Close in 69.80

CRUDE OILPreferably suitable for scalping and accurate as long as you enter carefully the price behavior with the drawn areas.
With your likes and comments, you give me enough energy to provide the best analysis on an ongoing basis.
And if you needed any analysis that was not on the page, you can ask me with a comment or a personal message..
Enjoy Trading... ;)

Crudeoil 1D TF, bullish trendline breaksHere on chart you can see the support horizontal line mark .
Trend line acting as resistance.
Break out will bullish structure

CrudeIt is consolidating in small range for last 3 week. There can be trending move in either side in coming week. Bias is on long side as natural gas has already given a move, crude can be the next candidate.

Crude Oil Outlook Mired by Negative Slope in 50-Day SMAThe price of oil appears to be defending the monthly low ($66.80) as it extends the rebound from the weekly low ($67.05), but failure to push above the 50-Day SMA ($71.95) may undermine the recent rebound in crude as the moving average reflects a negative slope.
Crude Oil Outlook
The price of oil may track the June range as it attempts to push above the $70.00 (50% Fibonacci extension) to $70.60 (61.8% Fibonacci retracement) region, with a push above the moving average raising the scope for a run at the June high ($75.06).
Next area of interest comes in around $75.60 (38.2% Fibonacci extension), but crude may track the negative slope in the moving average if it struggles to break/close above the $70.00 (50% Fibonacci extension) to $70.60 (61.8% Fibonacci retracement) region.
Failure to defend the monthly low ($66.80) may push crude towards $64.40 (61.8% Fibonacci extension), with a move below the yearly low ($63.64) opening up the $54.40 (78.6% Fibonacci retracement) to $56.50 (78.6% Fibonacci extension) area.
--- Written by David Song, Strategist

CRUDE OILPreferably suitable for scalping and accurate as long as you enter carefully the price behavior with the drawn areas.
With your likes and comments, you give me enough energy to provide the best analysis on an ongoing basis.
And if you needed any analysis that was not on the page, you can ask me with a comment or a personal message..
Enjoy Trading... ;)

WTI rallies form range lows - break of $70 up next?WTI crude posted a strong rally from the $67 support level thanks to another strong drawdown of crude inventories. The fact it rallied over 3% despite the stronger US dollar and hawkish comments from Powell makes us wonder if it could have broken above $70 were the dollar not to dominate FX majors on Wednesday. Still, prices are trading within a range between $67 - $72/73, and whilst prices action remains choppy o the daily chart there are some opportunities to trade the range on lower timeframes.
A triple bottom has formed on the daily along with a 2bar bullish reversal (bullish piercing line). String volumes accompanied the rally from the $67.50 area to show demand around those lows and the OBV (on balance volume) broke above its previous swig high, which hints at a breakout for prices.
Prices are drifting higher at the open, but we’d consider bullish setups above or around the daily pivot point or 10/20 EMAs if prices pullback for a potential swing-trade long to $70.A break above which brings the resistance zones around $71 and $72 into focus.

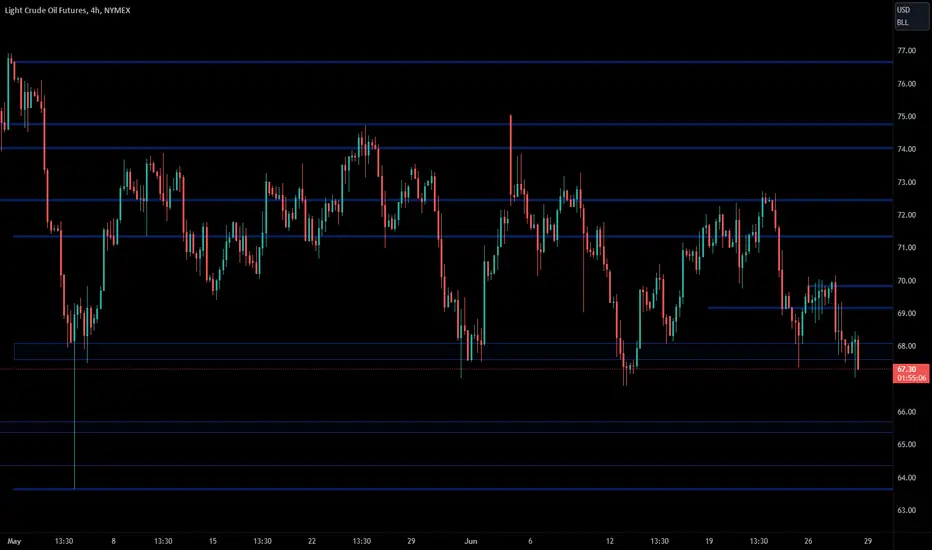
WTI Light Sweet Crude Oil, 6/29/23For Thursday, the 67.08 level can contain weekly selling pressures, above which 72.77 is attainable by the end of next week, possibly yielding 77.17 by the end of July.
Upside Thursday, 69.95 can contain session strength, while closing above 69.95 signals 72.77 within 2-3 days, where the market can top out into later next week and the point to settle above for yielding the more meaningful 77.17 within 3-5 more days.
Downside Thursday, closing below 67.08 indicates 64.10 within 3-5 days, 62.14 longer-term support within 2-3 weeks, where the broader market can bottom out through summer activity

CRUDE OIL REMAINS INDECISIVEOil prices surged nearly 3% on Wednesday, recovering from the previous day's losses, driven by a significant decrease in U.S. crude stockpiles. However, concerns about interest rates and central banks' fight against inflation limited the rally. WTI rose 2.8% to $69.62 per barrel. This marked the first significant gain in oil prices in a week. The Energy Information Administration reported a substantial 9.603-million-barrel drawdown in U.S. crude inventories, the largest weekly decline since May. Gasoline inventories built up slightly, while distillate stockpiles saw a modest increase.
Oil is facing uncertainty from Saudi Arabia implements production cuts as well, while central banks prepare to raise interest rates. The outcome is difficult to predict as economic growth continues in the West despite concerns of a recession. If Saudi Arabia's efforts fail, they may flood the market with supply. The correlation between oil demand, economic growth, and rising interest rates adds complexity to the situation. Lower oil prices and potential market fluctuations are expected. Overall, the interplay between various factors makes it challenging to make accurate predictions about oil prices.
On the technical site, RSI remains neutral, while MACD index continues to show sell signals.
The instrument might reach levels of 68.45 from which it might pivot to bearish territory, otherwise it might face resistance at 69.40 and 71.10 price levels.
Risk Disclosure: Trading Foreign Exchange (Forex) and Contracts of Difference (CFD's) carries a high level of risk. By registering and signing up, any client affirms their understanding of their own personal accountability for all transactions performed within their account and recognizes the risks associated with trading on such markets and on such sites. Furthermore, one understands that the company carries zero influence over transactions, markets, and trading signals, therefore, cannot be held liable nor guarantee any profits or losses.

4 Hr Cypher set up on $OIL $CL_F $USOIL $USO Wait for price action at 786 Fib level for long entry. Pin Bar, IB, Engulfing Bar, or low tf harmonic .
Full plan in chart, 2 % max risk on play, Suggest 1% <
Stop below X needs room 66.75$ or so.
I will share entry if triggered, I will leave an overnight limit as well if it does not trade, (smaller size on limit)
Tp stop is to entry, Aim higher, leave a runner, always.
The plan never changes, just the trading vehicle.. GL guys :)


CRUDE OILPreferably suitable for scalping and accurate as long as you enter carefully the price behavior with the drawn areas.
With your likes and comments, you give me enough energy to provide the best analysis on an ongoing basis.
And if you needed any analysis that was not on the page, you can ask me with a comment or a personal message..
Enjoy Trading... ;)
A Divergence Breakout Trading Setup Divergence is an indication of a market reversal.
However, traders always trapped into a lost trade if the market is entered with a wrong knowledge of the divergence setup.
Here is my setup identifying a valid divergence, and identifying a false breakout after a divergence.
In this strategy, I will use these indicators:
1. EMA 14: To confirm market direction (Buy or sell)
2. Commodity channel index (default setting): To identify market divergence
3. MACD: to confirm market buy/sell and validity of a divergence setup
4. Price action
5. Trendlines
