PAM2017 trade ideas


Traditional|PA1!|Long and shortLong and short PA1!
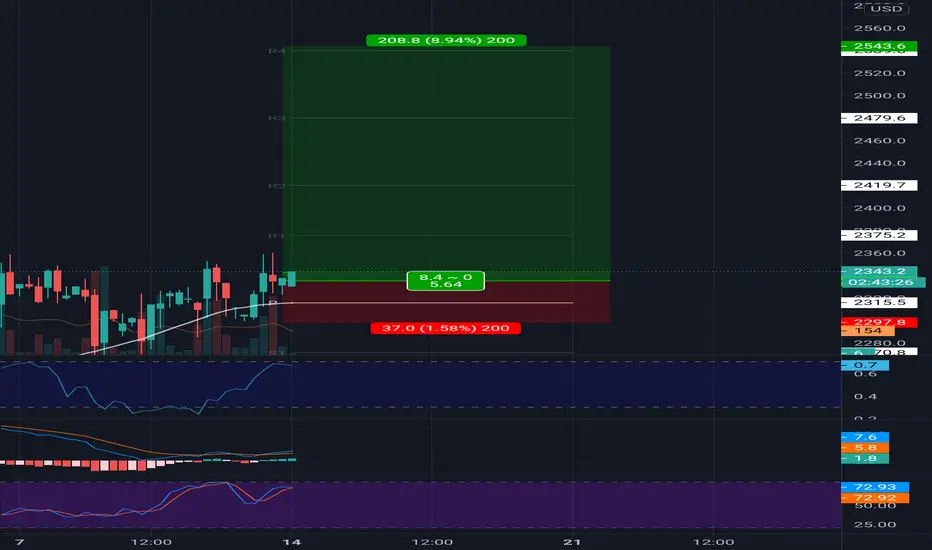
Activation of the transaction only when the blue zone is fixed/broken.
The author recommends the use of anchoring fixed the blue zone, this variation is less risky.
If there is increased volatility in the market and the price is held for more than 2-3 minutes behind the activation zone after the breakdown, then the activation of the idea occurs at the prices behind the activation zone.
Working out the support and resistance levels of the consolidation zone.
* Possible closing of a trade before reaching the take/stop zone. The author can close the deal for subjective reasons, this does not completely cancel the idea and is not a call to the same action, you can continue working out the idea according to your data, but without the support of the author.
+ ! - zone highlighted by the ellipse is a zone of increased resistance, in this area there is a possible reversal for a correction, please take this factor into account in this transaction.
The "forecast" tool is used for more noticeable display of % (for the place of the usual % scale) of the price change, I do not put the date and time of the transaction, only %.
The breakdown of the upper blue zone - long.
Breakdown of the lower blue zone - short.
Working out the stop when the price returns to the level after activation + fixing in the red zone.
Blue zones - activation zones.
Green zone - take zone.
Red zone - stop zone.
Orange arrows indicate the direction of the take.
Red arrows indicate the direction of the stop.
Priority - The value of the priority parameter implies the author's subjective opinion about the more likely activation zone on this idea, this does not mean that this idea will be 80% activated by this parameter, the purpose of the parameter is to provide for the risk of the inverse of the zone parameter.
Example: "Priority Long: So the author inclines more in the direction of the activation zone open long trades, in this case, when reaching the activation zone in short you should be very careful, because this area may be highly likely to be punched about the breakdown/do not get to take/activate transaction from go to stop."
Please consider this parameter if you use my ideas.
SUM PNL: This parameter displays the total % of all closed ideas of the "new" format (according to the author) for this sector at the time of publication of the idea. The calculation is very "clumsy" just the sum of the profits of all the ideas, based on this indicator, you can more accurately assess the risks when working with my ideas of this sector. I present you the construction of the idea, you can use it yourself as you like based on your subjective view and risks, the calculation of the PNL indicator is carried out only on transactions that the author closed on TV in manual mode or by take.
P.S Please use RM (risk management) and MM (money management) if you decide to use my ideas, there will always be unprofitable ideas, this will definitely happen, the goal of the system is that there will be more profitable ideas at a distance.


Traditional|PA1!|Long and shortLong and short PA1!
Activation of the transaction only when the blue zone is fixed/broken.
Testing the support and resistance levels of the consolidation channel.
* Possible closing of a trade before reaching the take zone.
The "forecast" tool is used for more noticeable display of % (for the place of the usual % scale) of the price change, I do not put the date and time of the transaction, only %.
The breakdown of the upper blue zone - long.
Breakdown of the lower blue zone - short.
Working out the stop when the price returns to the level after activation + fixing in the red zone.
Blue zones - activation zones.
Green zone - take zone.
Red zone - stop zone (S-SL short stop, L-SL long stop).
Orange arrows indicate the direction of the take.
Red arrows indicate the direction of the stop.


Palladium Future's Quarterly Line Break ChartWhat's next for this precious metal leader? Been in a line break defined uptrend since turn around in 2008 and confirmed in Q1 2010.

Palladium Update: Possible upswing soon. On the previous post on 8/4/20 I also suggested an upswing soon as the ".4" point was approaching.(see link below). But after the rise there has been a stall which may be soon over. So watch for signs of reversal. If this count is correct the next upswing could be a hefty one.
I don't trade futures. Other possibilities to trade this include PPLT, and mining stock IMPUY
Zacks
Impala Platinum Holdings Limited is in the business of mining, refining and the marketing of platinum group metals, especially platinum, as well as nickel, copper and cobalt. Implats is also involved in the secondary sourcing of material through Impala Refining Services which enables it to capitalise on the group's competitive advantages in processing and refining. The group's operations on the Bushveld Complex in South Africa (Impala Platinum, Marula Platinum, the Leeuwkop project and Two Rivers) and the Great Dyke in Zimbabwe (Zimplats and Mimosa) give it a significant base of attributable reserve and resource ounces of platinum. Implats also has investments in Aquarius Platinum Limited and its subsidiary Aquarius Platinum (South Africa) Limited which have PGM operations in southern Africa. There are also offshore exploration projects in Botswana, Mozambique, Madagascar and Canada.

Palladium futures - PA1! - Elliottwave analysis Palladium futures - PA1! - It is in simple ABC zigzag cycle, where A and B waves are already finished. Sell for C wave down with stops above 2415.25 near 2400 level for target below 2300 as medium odd trade set up.
Give thumbs up if you really like the trade idea.

PA1! - Palladium futures - Elliottwave analysis Welcome guys,
CycleWave is the top author sharing trade ideas based on EW analysis since last five months on the global stocks, currency pairs, cryptos, future indices and commodities. You can follow us to get more trade ideas/analysis.
PA1! - Palladium futures - It is in B wave as either triangle or it may extend the correction in more complex way. but it is definately sell set up once it completed the B wave. So stay bearish for C wave down. If price crosses above 2370 then B wave will extend correction higher, otherwise triangle confirmed and price will fall down directly to C wave.
Give thumbs up if you really like the trade idea.

PA1! - Palladium futures - Elliott wave analysis - sell set upWelcome guys,
CycleWave is the top author sharing trade ideas based on EW analysis since last five months on the global stocks, currency pairs, cryptos, future indices and commodities. You can follow us to get more trade ideas/analysis.
PA1! - Palladium futures - The drop seems in impulse wave A down and correcting up in B wave as double zigzag up. Sell it near the 2400-2440 zone for C wave down. In 4 hr time frame it is in sideway correction. Keep eye on the zone mentioned to sell it.
Give thumbs up if you really like the trade idea.


PA1! - Palladium futures - Elliott wave analysis - Buy - wait Welcome guys,
CycleWave is the top author sharing trade ideas based on EW analysis since last five months on the global stocks, currency pairs, cryptos, future indices and commodities. You can follow us to get more trade ideas/analysis.
PA1! - Palladium futures - It is in ABC zigzag up move in 2 hr time frame, while choppy in 8 hr time frame. The current price is in B wave down, so wait for more pull back up to 2300-2280 zone. where it turns bullish again for C wave up.
Give thumbs up if you really like the trade idea.

Trade Update: Sell 25-50% and move stop to breakeven
Real-Time Algorithmic Trading Signals. Stay curious

Buy: 2314.0
The Ingenuity Trading Model is a Hidden Markov Model with specific inputs related to Price, Time, Volume , and Volatility .


Palladium futures ( PA1!) - stay short Palladium futures (PA1!) is in B wave correction as mentioned in last updates, but it is extending B wave in complex wxy correction where abc of y in B wave is in progress. so stay short (dump) near 2240-2260 zone with stops above 2350 for C wave down of (Y) wave. The target zone will be 2060-2000 zone.

Palladium sustainsMarket is in range bound. I can say it is not a good idea to carry forward the positions for the next week.

Palladium futures (PA1!) - stay short Palladium futures (PA1!) is in B wave of Y wave down after A wave ended in impulse down as expected in previous updates. So wait for abc correction to end the B wave near 2250-2300 zone then short with stops above 2350 for target below 2100 or lower as C of Y wave.

Palladium futures (PA1!) - stay short Palladium futures (PA1!) is in WXY correction, where X wave was triple zigzag and has been finished. Wave Y is in progress as ABC zigzag, where A impulse down seems in progress. so stay in pull back only (if occur) with stops above 2286 as stops for target of huge down. if you found no entry then go one more try in B wave correction for C wave down of target zone for 2040.

Palladium: my initial idea may have been incorrect. Recently I posted on PALL a stock that buys and stores palladium (see link below). But when looking at the palladium futures and the price action since the first posting I think is today's posting may be more likely.
Process your way.
