RBM2018 trade ideas

Documenting Your Trades (For Fun and Profit)How do you document your trades? In a spreadsheet? In a trading journal? Directly on the chart? How much is too much? How little is not enough?
I say you need to document enough to tell the story properly. Every trade tells a story. As with all good stories you have a protagonist and an antagonist. Good guys and bad guys. The hero and the villain. And then, there's the journey.
In the markets you are the hero and the market is the villain. One way I make trading "fun" and what helps me "tell the story of the trade" is to "Trade Like a Pirate" and use the vocabulary of Jack Sparrow. I have already written on this topic when it comes to analyzing profit targets (seizing treasure and plunder) but let's look at how we learn what we did on a trade by trade basis.
When you do an after-the-trade analysis (what I call a postmortem) you should be able to see what you did right, what you could have done better, but most importantly, what you may have done wrong; not to beat yourself up, but to make sure that you *never* make that mistake or repeat that behavior again. (Fool me once, shame on you... fool me twice, shame on me!)
For instance, I once lost three trades in a row and asked "How the heck did that happen?" and later when I looked at the actual trade screenshots I realized that both my trading timeframe and trend timeframe was the same! Somehow instead of having my charts on the 60-15 minute charts they were *both* 15 and I realized if I had my chart timeframes right I would have never entered those particular trades, saving me from experiencing those losing positions. Thanks to those trades, though, and thanks to my post-mortem analysis, the first item on my "pre-flight checklist" is now "Verify Trade Timeframes." Thanks to journaling and the postmortem process I'm *never* going to make *that* mistake again.
But what about the *psychology* of the trade? *Why* did you enter it, *what* were you thinking once you were in it, *why* did you adjust your stop, *why* did you choose your target, *what* might you have done out of fear that got you out of the trade early or prevented you from realizing as much profit as you could have?
Journaling your trade, or documenting the trade *properly* will help you with that.
In the example above you can see a recent trade that presented itself to me and my pirate "Crew" in the Gasoline Futures market. I talk about the "weather conditions" before getting into the trade (the wind and the tide), other environmental factors like the "shark feeding frenzy area" helping me decide where I will target my profit (there be treasure *here*), what was going on when the trade actually entered, and finally, managing the trade to my target. In addition, during the postmortem I found an opportunity where if I had used a trailing stop, I could have gotten an additional 42% profit, or 'treasure'.
As I mentioned in my Backtesting series, one of the reasons you backtest is that through repetition, you can often find patterns in your system that will prompt you to tweak it to either *improve* results or *eliminate* inefficiencies. In this same manner, through repetition in documenting your trades you may very well find a pattern of behavior that is holding you back from your full potential.
For example, In the trade above, after securing 3R, (the minimum I am willing to take in a trade), if I followed price using my trailing stop strategy instead of a target, I found that I could have made an additional 2-3R profit. What if after documenting 20, 30, 40+ trades I find a similar pattern, that I am often "leaving money on the table"? I can then test several exit strategies to see which ones would give me the biggest bang for my buck and increase my R per trade.
The other big benefit of having your trade journal "tell a story" rather than "state facts" is you begin to *personify* the market and see it as someone who exhibits certain behavior patterns, and that is what the markets present to us every day: PATTERNS. And if you can determine someone's patterns, you can predict their behavior.
If I know that whenever my wife is browsing through a jewelry catalog and consistently goes "ooh" or "aah" over earrings with blue stones in them, I can guess with a high degree of accuracy that if I buy her a set of sapphire earrings she (and consequently*I*) will be a happy person. Likewise, if I can predict with a high degree what "Mister Market" is going to do based on certain patterns, I can keep setting sail, with confidence, day after day and see gains in my trading account (which makes me, my crew, and most importantly the missus, HAPPY! (Because when momma's happy, everybody's happy!).
Trade well! (And Journal Well!)
PS: Let me know how your journaling journey goes in the comments! I'd love to know how it "upped your trading game!" You can only improve what you analyze!
-Anthony

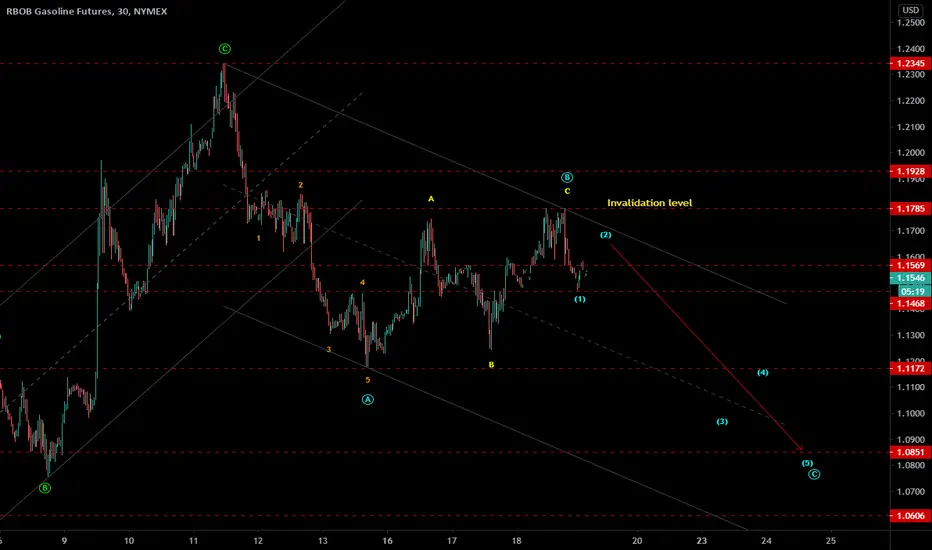
Gasoline futures RBOB - Elliottwave analysis - C downGasoline futures RBOB - It is in 2nd subwave of C wave in ABC zigzag correction down. Sell near 1.165 level with stop level above 1.179 for target below 1.085 or even more down side.
Give thumbs up if you really like the trade idea.
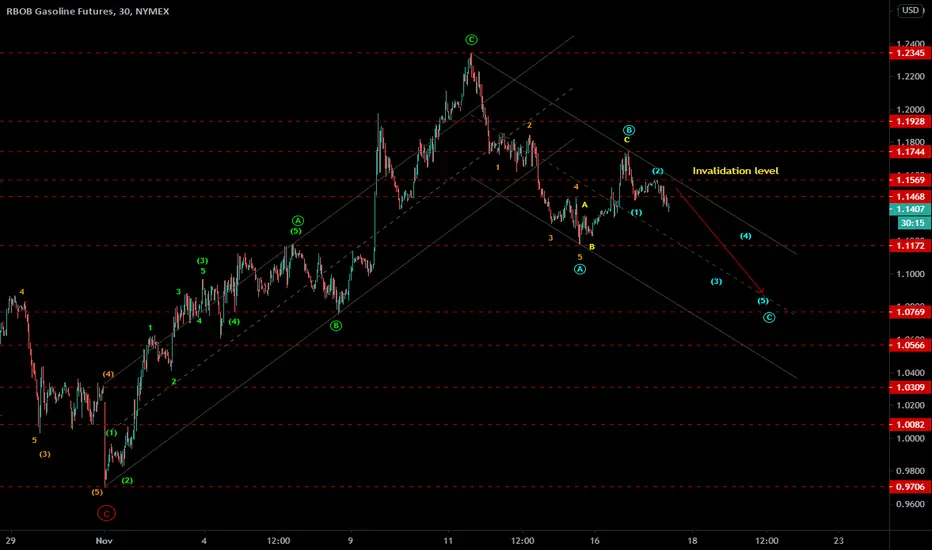
Gasoline futures RB1! - Elliottwave analysisGasoline futures RBOB - It is in ABC zigzag from major top and C wave is in progress. Sell it in 3rd wave down with stop level above 1.157 in slight bounce for target zone below 1.082 - 1.056 zone.
Give thumbs up if you really like the trade idea.
RBOB Gasoline SHORT from ~1.400 to under $1.000Try to Sell in the Gartley's PRZ @$1.35-$1.40 (also the LongTerm TL), w. a target of <$1.000 ($0.90-$0.95).22

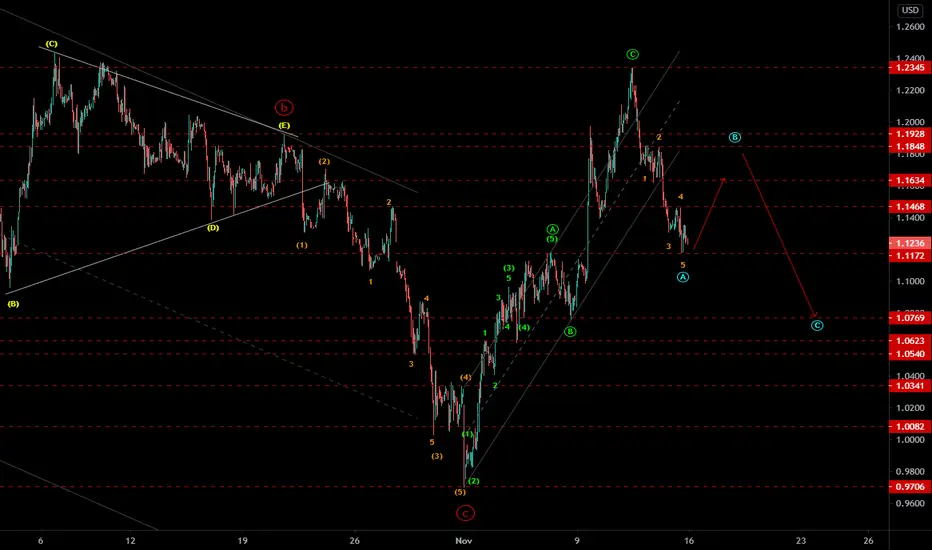
Gasoline futures RB - Elliott wave analysis - ABC zigzag Gasoline futures - RB - It dropped in impulse wave A down and expected to corrective up move as wave B, which might end between 1.163-1.850. So wait for B to finish, because thereafter there is a trade of sell set up for C wave down as ABC zigzag move down.
Give thumbs up if you really like the trade idea.

RBOB - RBZ2020AS YOU SEE, THIS IS QUITE IMPORTANT LINE, LETS SEE WHAT IT WILL DO
THERE IS STILL SOME SPACE BELOW TO BE TESTED, ALTHOUGH CURRENT MACRO FUNDAMENTALS ASKING FOR RISE, SEASONALS ARE SAYING OTHERWISE
I HAVE BEARISH BIAS TOWARD THAT


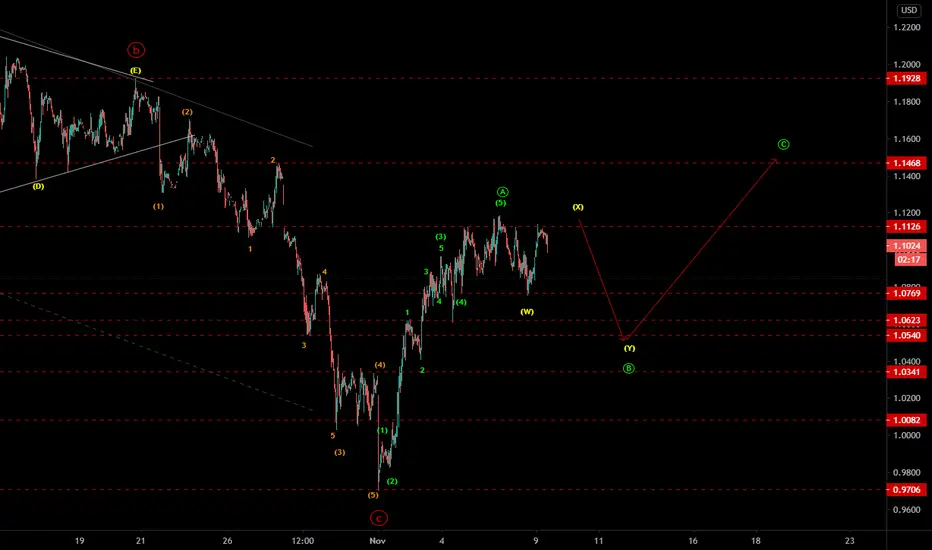
RB - Gasoline futures - Elliottwave analysis Gasoline futures - It is in B wave and probably do a flat correction. Stay bullish once it finished within the zone of 1.065-1.034 with stops level below 0.971 for target above 1.16 or higher.
Give thumbs up if you really like the trade idea.
Gasoline futures RB1! - Elliott wave analysis Gasoline futures (RB1!) - It has completed ABC zigzag down correction. The up move was impulse wave A and it seems like correcting down in wave B. This is the buy set up when B wave will finish near 1.034-1.008 for C wave up for target zone above 1.147 or higher. In 4 hr time frame this may the part of bigger (C) wave up from major bottom (Covid low). The pattern will be invalidated if price drop below 0.970 level.
Give thumbs up if you really like the trade idea.

Gasoline futures RB1! - Elliott wave analysis - Bear caseGasoline futures (RB1!) - It is in ABC zigzag down and C wave down is in progress. Sell with stops above 1.1468 for 3rd of 3rd wave down, which probably finishes near 1.0624 or lower.
Give thumbs up if you really like the trade idea.

RB1 is giving signal and strong momentum to buyAdvice from me. Don't put stop loss and take profit. Use alert

GASOLINE IS ON A DOWN TREND WHICH IS YOUR FRIEND FOR NOW Please share with me your point of view,
Regards.


Inter-commodity Spread (Dec20 +RB -CL)Looks like a good opportunity is coming up on this one. Fading the Dec20 RB(buy) CL(sell) Combo IC spread by selling into strength seems reasonable.

Gas future recovery lost all momentum, 200 SMA resistance?Hello Traders!
The price of Gasoline Futures has recently returned to its normal range but the momentum of its recovery seems to be completely used up. The 50 SMA may have recently crossed over the 100 SMA, but both the MACD as well as the RSI look rather pessimistic, both indicating bearish divergence. I would be very surprised if the price crossed over the 200 SMA, which has acted as resistance in the past, but let's better wait for the next few candles before we trade on weak signals.
VF Investment cannot be held responsible for any financial damages suffered from following our well-funded but personal opinions and trading ideas.
Please, maintain proper position sizing and risk management!

COT INDEX - POSSIBLE BOTTOMThe timing of commercials players trading Gasoline RBOB can be described as superb, with just one wrong signal since 2007. The COT Index possible bottom signal triggered this week, but before we jump in the trade there are some considerations of the actual scenario that need to be taken into account during our decision to take or not the trade.
I just read two articles one from the eternal bear ZeroHedge and another one from WSJ, and while 99.99% of traders and analysts would believe this is super bearish Oil. Such interpretation in the vacuum can lead to inaccurate conclusions. OPEC made a huge move with a record production cut to offset the demand destruction, and this can happen again. The ease in oil cuts is because they are anticipating demand recovery. This is the point where the confusion is made. There is a HUGE difference between demand and consumption. The former refers to the amount of a good that will be used at any given price level, and with supply determines the price, while the latter is the amount of a good used and its determined by the price.
An increase in demand means that more will be consumed at any given price level. Factors that might affect demand include disposable income, consumer tastes, and the price of substitute goods but, by definition not price. (Schwager & Etzkorn, 2017)
So the increase in production does not mean more of the product will flood the markets and pressure price down. The expectation is more consumption is ahead of us.
Another mistake that I see when taking this event of the increase in the output in production as bearish is the lack of perspective. What we saw months ago as a RECORD production cut, this increase is a drop in a bucket and has all elements to get unnoticed by the markets, in fact, it can have the opposite effect because it’s adding positive expectations of world economies recovery.
I am holding a BULLISH view on Gasoline RBOB.
Assets with BIG correlation with GASOLINE
Apache Corp NASDAQ:APA
Platinum NYMEX-PL1!
Avnet, Inc. NASDAQ:AVT
Precision Drilling Corp NYSE:PDS
Read the Full Report


RB1! bounce of support lineConfirmation candle shows repeating uptrend. Momentum is at the lowest point.
P:L , 2:1
