Oil to $84/bblBased on the idea of liquidity seeking; the orange box represents the 50% retracement, the top of the previous order block, and the Fair Value Gap region.
I am short CL unless it breaks above the previous day's high.
I'll consider a long if the setup materializes at $84.
QMN2020 trade ideas

CRUDE OILPreferably suitable for scalping and accurate as long as you watch carefully the price action with the drawn areas.
With your likes and comments, you give me enough energy to provide the best analysis on an ongoing basis.
And if you needed any analysis that was not on the page, you can ask me with a comment or a personal message..
Enjoy Trading... ;)


CL1!Before recession oil always rise and fall after it get started
1 target 130$-150$
then we will see pullback lower 60$, possibly 40$
expect to see next recession in next 6-9 months

CRUDE OILPreferably suitable for scalping and accurate as long as you watch carefully the price action with the drawn areas.
With your likes and comments, you give me enough energy to provide the best analysis on an ongoing basis.
And if you needed any analysis that was not on the page, you can ask me with a comment or a personal message..
Enjoy Trading... ;)

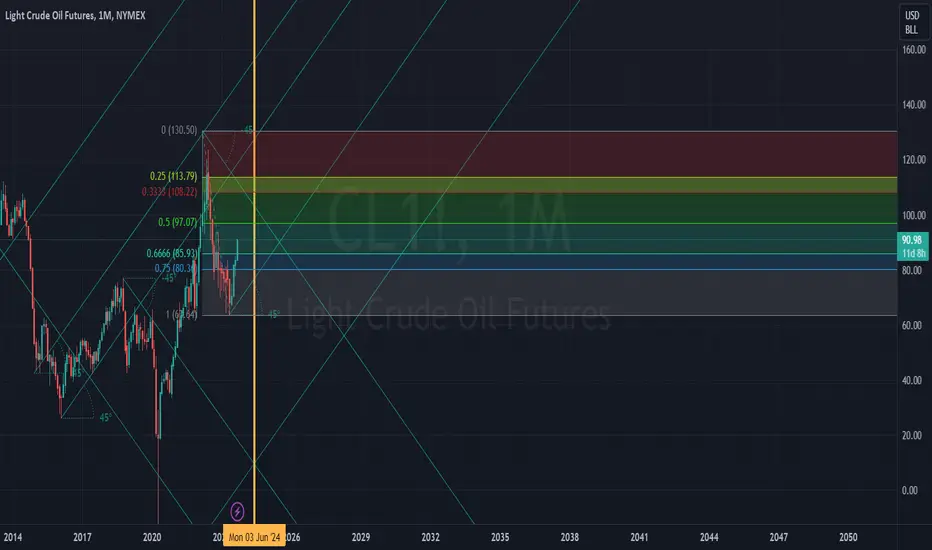
CL - Crude Oil Bold CallOh my..I think something big is on the way.
Let's first look at what we see on the chart:
It's a long-term chart, where each candlestick represents 3 months. Why did I take 3 months? Because I wanted to see the big picture.
Look at the red frame.
This is a daily chart, and with all the candles going up and down like a rollercoaster, it's messy and will keep you up all night.
The yellow chart is the same, but here I have only taken the swings and hidden the bars. And that's real peace of mind. It's clean and shows you where the real pivots are.
Let's go to the main chart.
The pitchfork goes back to the low we had in the 80s. This is the anchor for the A point. Then the top for B and the negative for C.
Do you see how the middle line catches the resistance and the support? What else? It's clean too. Going up in the time frame hides the noise.
From now on, the last 3 candles also have support at the centre line. And if I apply Human-AI-Pattern-Recognition (...what a word ;-), then I see a potential huge run-up towards the U-MLH (Upper-Medianline-Parallel).
Another fact that supports this thesis is that the USD has the potential to fall (see DXY analysis). And of course there will be other economic influences that will throw "oil" into the fire... kinda weird §8-)
However, as we can never have the whole cake and eat it too quickly without the cook cutting off our fingers, we have to wait for the first break of the last swing high, which can be clearly seen in the yellow frame.
Or we can start building a position now, taking on more risk but being rewarded with huge upside potential over the next few years.
However, my position with this analysis will be very long term. How will I play it? I don't know yet, but I'm considering building a CL monster with Black Magic Options Voodoo §8-)
Hope this helps and have a relaxing weekend.

Crude Oil Shows Potential Signs of ToppingCrude oil has been running since early summer, but there may be signs of a top.
The first pattern on today’s chart is the “shooting star” candlestick on Tuesday. Prices climbed to their highest level of the year before reversing lower. They dropped further on Wednesday, confirming the potentially bearish reversal pattern.
Second, CL1! has been at the top of its Keltner Channel. A potential reversion down the range could imply a drop of about 10 percent.
Third, Wilder’s Relative Strength Index (RSI) is dipping from its most overbought condition since March 2022.
Fourth, Rate of Change made a lower high this week as price made a higher high. That kind of bearish divergence often precedes reversals lower.
Finally, these patterns have occurred below the 93.50 area where crude oil had a double top in October and November 2022. That may suggest its longer-term trend has failed to become truly bullish.
TradeStation has, for decades, advanced the trading industry, providing access to stocks, options, futures and cryptocurrencies. See our Overview for more.
Important Information
TradeStation Securities, Inc., TradeStation Crypto, Inc., and TradeStation Technologies, Inc. are each wholly owned subsidiaries of TradeStation Group, Inc., all operating, and providing products and services, under the TradeStation brand and trademark. TradeStation Crypto, Inc. offers to self-directed investors and traders cryptocurrency brokerage services. It is neither licensed with the SEC or the CFTC nor is it a Member of NFA. When applying for, or purchasing, accounts, subscriptions, products, and services, it is important that you know which company you will be dealing with. Please click here for further important information explaining what this means.
This content is for informational and educational purposes only. This is not a recommendation regarding any investment or investment strategy. Any opinions expressed herein are those of the author and do not represent the views or opinions of TradeStation or any of its affiliates.
Investing involves risks. Past performance, whether actual or indicated by historical tests of strategies, is no guarantee of future performance or success. There is a possibility that you may sustain a loss equal to or greater than your entire investment regardless of which asset class you trade (equities, options, futures, or digital assets); therefore, you should not invest or risk money that you cannot afford to lose. Before trading any asset class, first read the relevant risk disclosure statements on the Important Documents page, found here: www.tradestation.com .

Is crude oil about to take a dive? 📉 The Crude Oil short I mentioned has set up today on the daily chart 📉 I am long CL 91.00 Puts and have also taken some Event Contracts for today to close below 90.50 and 90.00. The setup originated from yesterday's close and the resistance level is now at 90.37. CL1!
To guide my decision-making, I'll be using the 5-day moving average, which currently stands at 90.27 📊 This setup involves using options, event contracts, and intra-day shorting with futures.
If the daily close goes above 90.27, I'll scale back, and if we surpass the recent high of 92.43, I'll exit the position ❌ My target area is 85.10 🎯, and I'll start scaling out of shorts when we drop below 88.00 ⬇️
Given the upward trend, I prefer scaling out in front of targets when there's a mean reversion trade.

CRUDE OIL LONG-TERMPreferably suitable for scalping and accurate as long as you watch carefully the price action with the drawn areas.
With your likes and comments, you give me enough energy to provide the best analysis on an ongoing basis.
And if you needed any analysis that was not on the page, you can ask me with a comment or a personal message..
Enjoy Trading... ;)

WTI Oil Prices Face Selling Pressure as Fed's Hawkish Stance...WTI Oil Prices Face Selling Pressure as Fed's Hawkish Stance Dominates
Western Texas Intermediate (WTI) crude oil prices are grappling with selling pressure, hovering around the $88.80 mark. The Federal Reserve's recent meeting and its hawkish stance have cast a shadow over oil prices, complicating the outlook for the energy market.
Here are the key factors influencing WTI oil prices:
1. Fed's Influence on Oil Prices:
Following the Federal Reserve's recent meeting, WTI oil prices experienced a continuation of selling pressure. The Fed opted to keep interest rates unchanged and issued hawkish comments. Fed Chairman Jerome Powell reiterated the central bank's commitment to achieving a 2% inflation target and expressed readiness to raise rates if deemed necessary. The prospect of higher interest rates in the US has a direct impact on oil prices. Elevated interest rates can raise borrowing costs, potentially slowing economic growth and reducing oil demand.
2. Saudi Arabia's Stance on Oil Production:
Saudi Crown Prince Mohammed bin Salman clarified that OPEC's decision to reduce oil production was primarily motivated by a desire for market stability and not aimed at supporting Russia's actions in Ukraine. In recent weeks, both Saudi Arabia and Russia, the world's top two oil exporters, announced voluntary production cuts. These measures have played a role in supporting WTI prices, with both countries committing to sustaining reduced oil output until the end of 2023. Saudi Arabia is set to limit its oil production to approximately 1.3 million barrels per day through the end of 2023.
3. Crude Oil Inventory Reports:
Crude oil inventory reports have also influenced market sentiment. The American Petroleum Institute (API) reported a significant decline of nearly 5.25 million barrels in US crude oil inventories for the week ending September 15. This contrasted with the previous reading, which showed a rise of 1.174 million barrels. Market expectations had been leaning towards a 2.7 million-barrel decline. Additionally, the Energy Information Administration (EIA) reported a decrease of 2.135 million barrels in crude oil stockpiles during the same period, compared to a previous increase of 3.954 million barrels. The market had anticipated a drawdown of 2.2 million barrels.
4. Upcoming Economic Data Impact:
Looking ahead, oil traders are closely monitoring several economic data releases that could significantly influence WTI prices. These include the US weekly Jobless Claims, the Philly Fed Manufacturing Index, and Existing Home Sales, all scheduled for release later on Thursday. Furthermore, the preliminary US S&P Global PMI for September is expected to be released on Friday. These events will be of particular interest to traders as they could impact the USD-denominated WTI price.
In conclusion, WTI oil prices are currently navigating a complex landscape, with the Federal Reserve's hawkish stance and global oil production dynamics playing key roles. The energy market will closely follow economic data releases for insights into the future direction of oil prices, offering trading opportunities for investors.

CRUDEOILPreferably suitable for scalping and accurate as long as you watch carefully the price action with the drawn areas.
With your likes and comments, you give me enough energy to provide the best analysis on an ongoing basis.
And if you needed any analysis that was not on the page, you can ask me with a comment or a personal message..
Enjoy Trading... ;)

Oil - some weakness ahead?This Elliott Wave count suggests that oil's rally may be due a rest and a period of weakness may now take place. From an EW point of view it has some alternation in it's 2nd and 4th wave corrections between deep and shallow. The 3rd wave ended exactly to the 1.61 fib extension and the 5th wave completed on the .61 fib extension of waves 1 to 3. It also completed on the top of the channel. Perfect Elliott Wave? Lots going for the count so lets see how wrong I am....

November WTI Crude Oil Rejects $92 Today After A Long RallyCLX23 did not like $92 today.
Is a minor correction coming?
Is it time to get a little bearish for the next few days/weeks to come?
Going into winter, should I expect a little demand destruction and orderly technical selling?

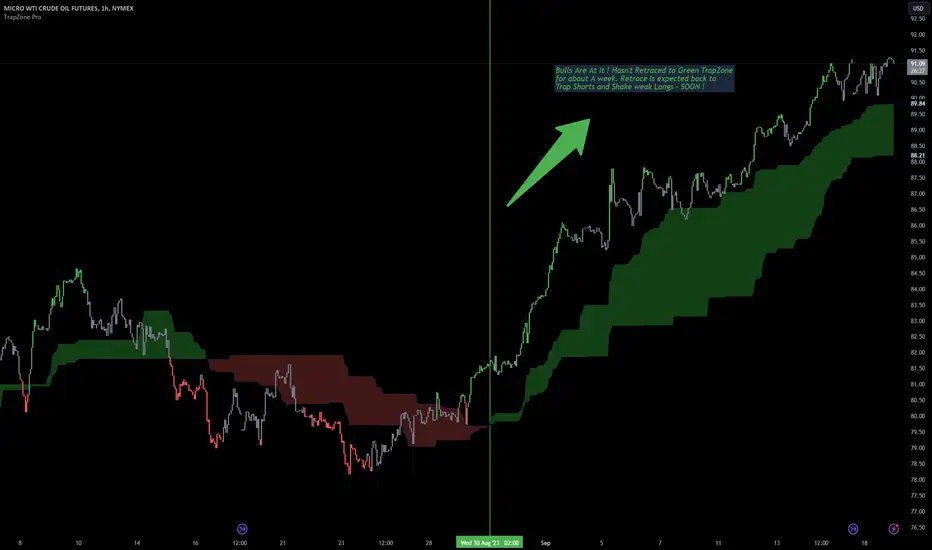
No retrace to the TrapZone ? How long is this LONG move?Bulls Are At It, Offcourse. When do you take Profits though ? Trap Bars are forming Now.
price Hasn't Retraced to Green TrapZone for about A week. Retrace Is expected back to Trap Shorts and Shake weak Longs - SOON !
Hourly Candlestick Chart of MCL/ Crude Futures with TrapZone Pro
Crude Oil, Waiting, hold and longThe inflation is going to bloom. The US reserved oil is depleted and once the government trying to refill it, the price will keep going up. If you already have the position for crude oil, hold it and don't short. If you haven't enter the market. The opportunity is approaching. Waiting patient when it touches the base line, then long it. Wait for it when withdraw back.

Short oil @ 90.60 with a stop on close above 92.4Commercials are max short and both Large & Small speculators are long. Today looks like a reversal day. Everyone is expecting $100+
www.bloomberg.com
"Oil surged to a 10-month high — extending a powerful rally that may rekindle inflation — as supply cuts from OPEC+ tightened the market, with Saudi Arabia’s energy minister shying away from any change in course.
Global benchmark Brent topped $95 a barrel for the first time since November, advancing for a fourth day after Saudi Arabia and Russia curtailed production. The tighter market has ignited a flurry of predictions that $100 oil could soon return in a roster than runs from industry heavyweights such as Chevron Corp. Chief Executive Officer Mike Wirth to traditional bears at Citigroup Inc.

CRUDE OILPreferably suitable for scalping and accurate as long as you watch carefully the price action with the drawn areas.
With your likes and comments, you give me enough energy to provide the best analysis on an ongoing basis.
And if you needed any analysis that was not on the page, you can ask me with a comment or a personal message..
Enjoy Trading... ;)


CRUDE going to take a short pullbackwhile going through the price action it can be a pullback to 3rd point.
the pink box which is having more green candles can act as support where buyers actullly entered with huge volumes.
trade with caution as fall can be faster after a while when bulls loose momentum.

My Opinion on OilSaudi Arabia's decision to cut oil production could potentially have a significant impact on its GDP, given that approximately 80% of the country's revenue comes from oil exports. This reduction in oil production may lead to a budget deficit by the H2 '23.
One logical reason behind this production cut is the potential for higher oil prices, driven by supply constraints. The United States, with its Strategic Petroleum Reserve (SPR) at historically low levels (around -60% of its reserve capacity), may be forced to buy that expensive oil. This could be financially advantageous for Saudi Arabia, as it could sell its oil at higher prices in a tight global market.
I confidently see oil above $100

Crude Oil Sets Fresh 2023 High as RSI Sits in Overbought ZoneThe price of oil continues to carve a series of higher highs and lows to register a fresh yearly high ($91.36), and crude may continue to approach the November 2022 high ($93.74) as the Relative Strength Index (RSI) holds above 70.
Crude Oil Outlook
The price of oil has cleared the range-bound price action from earlier this month to keep the RSI in overbought territory, with a break above the November 2022 high ($93.74) bringing the August 2022 high ($98.65) on the radar.
However, failure to test the $93.50 (38.2% Fibonacci retracement) to $93.70 (50% Fibonacci retracement) area may generate a textbook sell signal in the RSI, with a move below the $86.60 (38.2% Fibonacci retracement) to $87.30 (78.6% Fibonacci retracement) raising the scope for a test of the monthly low ($83.46).

crude enjoyed made 91$++ in mcx 7650 near crude enjoyed made 91$++ in mcx 7650 near ---- told abv 90.55 in mcx 7555 it will rock see nowww buyer zoomed yes spot crude 93+++++ expect in mcx 7800++++++

black goldresistance of trump era turned to support in biden era.
97 would be next major resistance but overall, this is a chart that wants to make new highs.