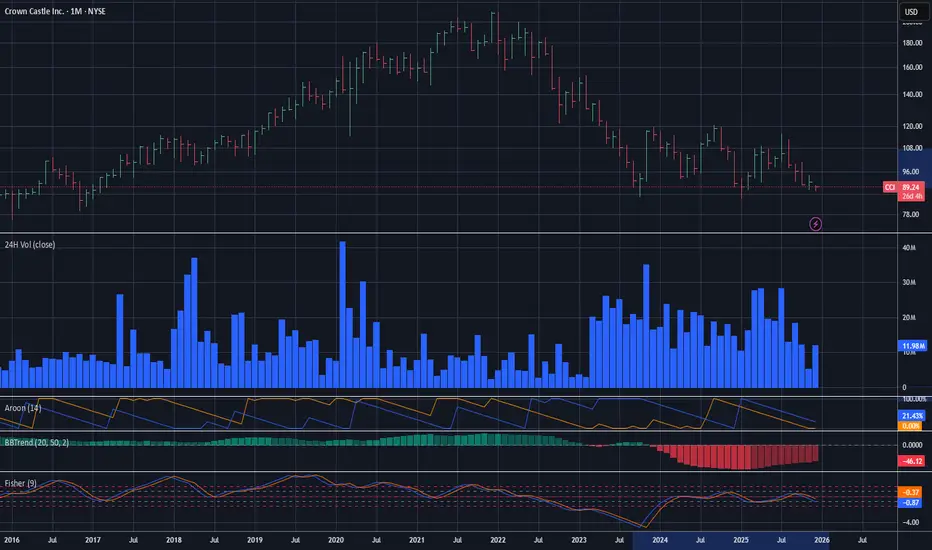
CCI at 84.78 is sitting at 22.2CCI at 84.78 is sitting at 22.2 percent of range between 75.96 and 115.76, floor classification, directly under a supply zone that has been overhead since the sustained downtrend began. The bounce reading is 11.6 percent at only 1.6x with a 7.2 percent deep retrace — a recovery attempt from a heavil
Compare with Crown Castle Inc.
4.55 USD
444.00 M USD
4.26 B USD
425.02 M
Next report date
—
Report period
—
EPS estimate
—
Revenue estimate
—
Company info
Sector
Industry
CEO
Christian H. Hillabrant
Website
Headquarters
Houston
Founded
1994
IPO date
Aug 18, 1998
ISIN
US22822V1017
CUSIP
22822V101
FIGI
BBG000FV1Z23
Identifiers
ISIN US22822V1017
Crown Castle, Inc. engages in the business of owning, operating, and leasing shared communications infrastructure. It operates through the following segments: Towers, Fiber, and Other. The Towers segment focuses on providing coverage and capacity for wireless carrier network deployments. The Fiber segment includes communications infrastructure offerings of small cells and fiber solutions. The Other segment is involved in corporate assets such as cash and cash equivalents. The company was founded by Ted B. Miller Jr. and Edward C. Hutcheson Jr. in 1994 and is headquartered in Houston, TX.
Crown Castle (CCI) is showing strong bullish potentialAfter forming a lower low on the chart, the stock signals a potential reversal in trend. With improving fundamentals and growing demand for 5G infrastructure, there's solid support for a continued uptrend and it will hit a new higher high around $120.
Crown Castle Inc. (CCI) 1WTechnical Analysis
- The weekly chart of Crown Castle Inc. (CCI) shows a potential reversal after a prolonged downtrend.
- A breakout above the descending trendline and consolidation above $110.85 (0.786 Fibonacci) could signal the start of an upward movement.
- Key Resistance Levels: $132.06 – $
buying opportunity for investors with a long-term perspective.Technical Analysis:
As of January 1, 2025, CCI's stock is trading at $90.76. The 50-day moving average is approximately $104.43, and the 200-day moving average is around $104.87, indicating a recent downward trend. The Relative Strength Index (RSI) is at 13.92%, suggesting the stock is oversold, wh
Crown Castle Inc. (CCI) - SK Sequence Strategy AnalysisTrading the Sequence Setup:
Entry Zone:
Buying near the WCL zone ($98–$105) provides a favorable risk-reward opportunity, following the sequence structure.
Stop Loss:
Place stops below $95 to protect against a breakdown in the sequence.
Profit Targets:
T1: $148 (1.618 Fib extension)
T2: $155
$CCI - big move but needs supportREITs showing a similar pattern before earnings…. Keeping an eye on them.
This just ran to its previous resistance. Tested it multiple times. It wants to break through.
Fibs channel shows plenty of space to swim from the 1week fib chart. At 4 hours, you see the indicator flashing bullish signs.
N
See all ideas
Summarizing what the indicators are suggesting.
Neutral
Neutral
Neutral
An aggregate view of professional's ratings.
Neutral
Neutral
Neutral
Displays a symbol's price movements over previous years to identify recurring trends.
Maturity dateFeb 15, 2049
Coupon5.20% (Fixed)
Maturity dateJan 15, 2051
Coupon3.25% (Fixed)
Maturity dateJul 1, 2050
Coupon4.15% (Fixed)
Maturity dateApr 1, 2041
Coupon2.90% (Fixed)
Maturity dateMar 1, 2034
Coupon5.80% (Fixed)
Maturity dateSep 1, 2034
Coupon5.20% (Fixed)
Maturity dateMay 1, 2033
Coupon5.10% (Fixed)
Maturity dateJul 15, 2031
Coupon2.50% (Fixed)
Maturity dateApr 1, 2031
Coupon2.10% (Fixed)
Maturity dateJan 15, 2031
Coupon2.25% (Fixed)
Maturity dateJul 1, 2030
Coupon3.30% (Fixed)
See all CCI bonds
Frequently asked questions
The current price of CCI is 68.89 USD — it has decreased by −1.26% in the past 24 hours. Watch Crown Castle Inc. stock price performance more closely on the chart.
Depending on the exchange, the stock ticker may vary. For instance, on NYSE exchange Crown Castle Inc. stocks are traded under the ticker CCI.
CCI stock has risen by 1.90% compared to the previous week, the month change is a −9.52% fall, over the last year Crown Castle Inc. has showed a −27.35% decrease.
We've gathered analysts' opinions on Crown Castle Inc. future price: according to them, CCI price has a max estimate of 120.00 USD and a min estimate of 80.00 USD. Watch CCI chart and read a more detailed Crown Castle Inc. stock forecast: see what analysts think of Crown Castle Inc. and suggest that you do with its stocks.
CCI stock is 2.70% volatile and has beta coefficient of 0.18. Track Crown Castle Inc. stock price on the chart and check out the list of the most volatile stocks — is Crown Castle Inc. there?
Today Crown Castle Inc. has the market capitalization of 29.31 B, it has increased by 2.45% over the last week.
Yes, you can track Crown Castle Inc. financials in yearly and quarterly reports right on TradingView.
Crown Castle Inc. is going to release the next earnings report on Oct 21, 2026. Keep track of upcoming events with our Earnings Calendar.
CCI earnings for the last quarter are 0.22 USD per share, whereas the estimation was 0.39 USD resulting in a −43.65% surprise. The estimated earnings for the next quarter are 0.68 USD per share. See more details about Crown Castle Inc. earnings.
Crown Castle Inc. revenue for the last quarter amounts to 1.01 B USD, despite the estimated figure of 995.05 M USD. In the next quarter, revenue is expected to reach 1.01 B USD.
CCI net income for the last quarter is 94.00 M USD, while the quarter before that showed 151.00 M USD of net income which accounts for 0.00% change. Track more Crown Castle Inc. financial stats to get the full picture.
Yes, CCI dividends are paid quarterly. The last dividend per share was 1.06 USD. As of today, Dividend Yield (TTM)% is 6.17%. Tracking Crown Castle Inc. dividends might help you take more informed decisions.
As of Oct 9, 2026, the company has 4 K employees. See our rating of the largest employees — is Crown Castle Inc. on this list?
EBITDA measures a company's operating performance, its growth signifies an improvement in the efficiency of a company. Crown Castle Inc. EBITDA is 2.69 B USD, and current EBITDA margin is 65.10%. See more stats in Crown Castle Inc. financial statements.
Like other stocks, CCI shares are traded on stock exchanges, e.g. Nasdaq, Nyse, Euronext, and the easiest way to buy them is through an online stock broker. To do this, you need to open an account and follow a broker's procedures, then start trading. You can trade Crown Castle Inc. stock right from TradingView charts — choose your broker and connect to your account.
Investing in stocks requires a comprehensive research: you should carefully study all the available data, e.g. company's financials, related news, and its technical analysis. So Crown Castle Inc. technincal analysis shows the sell today, and its 1 week rating is sell. Since market conditions are prone to changes, it's worth looking a bit further into the future — according to the 1 month rating Crown Castle Inc. stock shows the sell signal. See more of Crown Castle Inc. technicals for a more comprehensive analysis.