DigitalOcean ($DOCN) | Cloud Computing Powerhouse - AWS for SMBsNYSE:DOCN
DigitalOcean remains the only pure cloud computing company for small-to-medium-sized businesses (SMBs), offering a robust solution similar to AWS, but with a specific focus on cost-effectiveness and ease of use for smaller enterprises. The introduction of GPU droplets further strengthens its position in the market, catering to the growing need for AI and machine learning workloads.
Despite struggles with corporate governance, the company’s technology is top-tier, making NYSE:DOCN an attractive acquisition target for larger tech players. The stock has doubled in volume recently, indicating bullish momentum is building, and we believe this sets up for a breakout.
This is a long-term hold for those looking for high growth in the cloud sector. GPU droplets could accelerate this growth, positioning DigitalOcean as a critical player in a market poised for massive expansion. It is not too late to enter as we are just beginning to breakout. Should macro-driven events pull down the market, especially SMBs, we will be adding at key levels.
Our entries: $24.50, $31.50, $35, Breakout over $39
Targets: $50, $70, $80
DigitalOcean is not just a small player in the cloud space; it has a specific niche that positions it for explosive growth. As SMBs increasingly adopt cloud technologies, and with GPU droplets creating a new revenue stream, DigitalOcean is set to rise. While near-term volatility exists, the long-term growth story remains intact. Investors should look at this as a multi-year play, with opportunities to accumulate during any market weakness.
DOCN trade ideas

5/9/24 - $docn - what upside? i'm short the AM print.5/9/24 - vrockstar - love the company and hate the valuation here. massive gap at $20. need to adjust EPS for the debt (which is a toxic factor right now!) and you're in the high 20s (at the least) and closer to low 30s on my ests of how the market is thinking about b2b eps resets. 6x sales is too much for 10% sales growth too. not my rules. if you own it, i don't see the upside here. pls comment below if i'm missing s/t obvious. but this looks like a short candidate and sorry to be the bearer of bad news. i just call em like i see em and hopefully the logic adds to your thinking for your own decision making.

DOCN rises from Fib level support LONGDOCN ona 120 minute chart has downtrended into the support of a 0.5 Fib retracement from
the rise after the November earnings. and the triple top then trend down from the
last earnings. I believe that is is well situated to rebound toward that triple top again
in the next three weeks until earnings. I realize that based on the inicators a long trade
would be buying weakness but I believe buying at undervalue is a good buy low with
an expectation of 15-18% upside.

$DOCN Base on Base Ready to Breakout?I got into this one on Mar 6th when it re-took the 20 EMA (green) where it also found support at the 50 DMA (red). My plan was to bring up to a full-sized position on a breakout over 41.07. However, on the 13th when it did break above that it promptly pulled back. Fast forward to today once it moved back over Friday’s high (which again found support at the 20 EMA) I did make it a full-sized position.
The true breakout is yet to come. It needs to close over 41.07 for that to happen. From the low in November to today this stock is up over 100%. I think it can double again. My plan is to add anytime it bounces back off the 20 EMA. My stop will be on a “decisive” close under the 20 EMA but not more than 5% loss, whichever is less.
This may be one you want to look at. If so, make it your own trade and follow your own rules.
The chart I am using is the All-In-One LevelUp tool available here on TV. Check it out.
Ideas, not investing / trading advice. Comments always welcome. Thanks for looking.

DOCN: CLOSING GAPLONG
- breaking through resistance
- 1W RSI with positive dynamics
- OSMA is positive
- price above 1D 50/200 EMA
- golden crest 1D TF
- 1D TF marribon is positive and opened
- mug patter
TP1: 46.36
TP2: 57.17
SL: 31.54

The Rising Potential of DOCN Stock in the NASDAQ MarketWith the cloud computing industry expected to grow significantly, DigitalOcean's position and approach align well with this trend, suggesting a bright future for its stock in the NASDAQ market.

Digital Ocean (NYSE:DOCN): Capitalizing on the AI RevolutionDigital Ocean (NYSE:DOCN), a leading American cloud provider helping start-ups and small and medium-sized businesses (SMBs) scale cloud-stored data, is capitalizing on the AI revolution in cloud computing. DOCN is a growth-focused opportunity that is still trading below its Q2 peak while making waves in the increasingly demanding AI and machine learning (ML) arenas. Strategic initiatives, impressive earnings, and an imminent leadership change present a bullish growth opportunity I wouldn’t want to miss.
Why is DOCN Poised for Growth?
DigitalOcean has been riding the AI wave following its acquisition of Paperspace, which provides cloud infrastructure for graphic processing units (GPUs) — a key component for Cloud Hosting. The acquisition closed in Q3 but has seen Paperspace customers migrating through November, with full integration expected by December 1.
The company is poised for growth, doubling down on the new trend of cloud hosting. In October, it introduced a cloud-hosted scalable storage for managed databases, further addressing the growing demand for AI and ML. This strategic initiative enables businesses to scale up to 15TB storage capacity efficiently, meeting the data-intensive requirements of AI/ML applications. DOCN’s move caters to a key demographic increasingly adopting AI/ML technologies: start-ups and SMBs.
How do DOCN’s Financials Look?
In Q3, DigitalOcean continued its upward trajectory, reporting revenue of $177 million, a year-over-year increase of 16%. The company’s annual run-rate revenue (ARR) also grew by 11% year-over-year, reaching a significant $713 million compared to $682 million in Q2. The improved financial performance reflects strong demand for Digital Ocean’s services, driving the company’s profits, with non-GAAP EPS nearly doubling on a trailing-nine-month basis to $1.16 per share.
Is Now a Good Time to Buy DOCN?
In addition to capitalizing on the new cloud hosting trend, DOCN has fallen by 15.9% in the past six months. While this might seem alarming initially, the stock is still a decent investment opportunity since it has dropped by over 40% since its July peak of $51.67, primarily for administrative reasons.
Shares fell after it reported a discrepancy in its earnings, but it was an overstatement of its tax liability. Today, it trades almost 50% higher from its November 1 low of $19.39 per share, at $28.89, leaving about 79% upside potential to July’s top.
DOCN: A Promising Growth Opportunity
DigitalOcean’s focus on scalable solutions for data-intensive applications positions the company well to capitalize on the growing demand for AI and ML technologies. Combined with its impressive financial performance and an imminent leadership change, DOCN presents a promising growth opportunity for investors. The company’s focus on scaling start-ups and SMBs positions it favorably to capitalize on future market trends.

DOCN MACD, RSI cross, gonna boom20% at least this time due to macd and rsi crossing.
trading have risk, so be aware

The Cloud Computing Slowdown Hits DOCN: Watch the breakdownMarketWireNews:
Businesses big and small are looking for ways to rein in costs as a tough economy fuels uncertainty. An easy target for these cost cuts is cloud computing. The mega-cloud platforms like Amazon Web Services (AWS) and Microsoft Azure have already suffered a sharp slowdown as customers optimize spending. AWS grew by 12% year over year in the second quarter, while Azure posted 26% growth.
DigitalOcean (NYSE: DOCN) focuses on serving developers and small businesses. While this makes its customer base fickler than the enterprise-heavy cloud giants, its customers likely have less fat to cut from their cloud computing bill. An enterprise customer spending millions each year with cloud resources spread across dozens of teams is more likely to have let cloud spending get away from it than a small business shelling out 90 bucks a month.
Even so, DigitalOcean is now starting to feel some pain. The company's revenue grew by 27% year over year in the second quarter, but the real story was its guidance. DigitalOcean sees growth slowing way down in the third quarter, and it cut its full-year guidance to reflect weaker demand for cloud computing services.
Technically:
Cycle Sniper and Cycle Filter indicators' bearish signals are about to be confirmed by the
breakdown of the short term Fractal Trend Line.
If the price breaks down the fractal line,it is likely to test 29$ and 25$.
Good Luck

DOCN - Trade from support line- trade from support line
- the price is almost on Pivot P
- the rising wedge has already reached the target after breaking down
- 1D RSI is very heavily oversold
- stochastic is almost 10 days in the bottom zone. the last time before the bull market this continued for 16 days.
- OSMA started to turn positive
- the price must also close the upper gap

DOCN following a set pattern Digital OCean has been on a bearish trend since Nov 21
Doing an simulation on the movement it seems the only way it can show some reversal signs is when it breaks the TASE:43 strong resistance
If it does go that way it means it will be confirmation of 2 year running bear pattern and it can quickly fill gaps upside
Entry @ HKEX:45
SL @ HKEX:40
TP : ride the bullish reversal

$DOCN looks like it's heading back to support level at $30~$DOCN looks like it's heading back to support level at $30~ .. full path on chart
Btw.. I have made a fortune from this name last year.. i called it when it was $40~ and it went all the way up to $110

watching for trigger 🥝break of trend resistance/31.16 for explosive breakout, break below 25.68 and trend support zone for downside continuation. 🎯
boost and follow for more!

DOCN bowl retracement Digital Ocean seems to have retraced to the bowl support, and to the diagonal support it broke out on 4th August.
If this bowl plays out well, then potentially we'll reach ATH in a few months.

broke 8 month downtrend, now what?👀till needs to clear 56.23, after that we can expect a real rally towards all time highs. watching closely!
targets once we have trigger confirmation 64-81-98

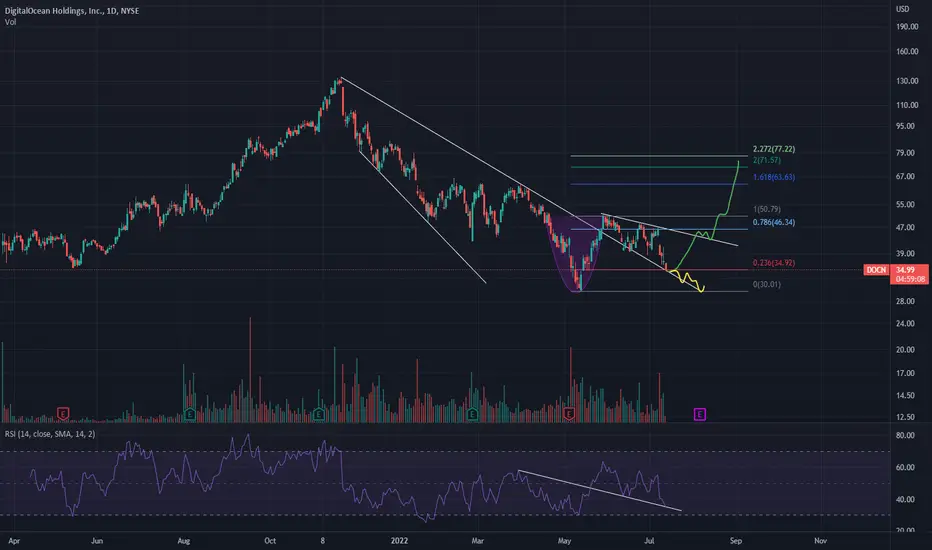
DOCN - cup and handle Cup has already formed and handle is in a declining expanding wedge format. Breakout of the upper wedge resistance is likely and then to be held as support. Fib levels mark price targets .
RSI support as well
Waiting for Reversal ConfirmationStill going sideways on support & resistance zone.
Need a confirmation of uptrend.
Stock is not that cheap.

DOCN **MAJOR move inbound**??- I have extrapolated the 26 EMA on the daily as this has proven to be a great support and now resistance level. Breaking above this level would be a super bullish movement.
- the Fib golden pocket support level has been touched
- the 1 year RSI is touching the 30% level.
- Potentially a nice looking bowl but we can't confirm until we see around 2 bounces on right hand side

$DOCN @digitaloceanDigital Ocean now at MA200 support level. Is it time to go up? Follow me for trading ideas!

DOCN at crucial support. Digital ocean has hit a crucial support.
With a h&s pattern formed in the last two weeks of Feb, it broke the neck-line Yesterday and has since hit its h&s pt of $71.50.
- This is also a crucial support level of a channel which was created throughout the first couple if quarters since IPO.
- The 6 month RSI has also re-entered its buy zone below 30%
- MACD support touched.
- Possible double bottom here as well - PT of $98.
- Gap to fill at $130
All PTs on chart

The Top 3 Elements Found In All Good Trading PlansHey everyone! 👋
This month, in preparation for the new year, we have been theming our posts around the concept of building a solid trading plan. Our first post asked you to think about the kinds of factors that can predict long term success. Our second post looked at why trading plans are so important. Both of these posts you can find linked at the end 👇
Having talked about the *what* and the *why*, it’s time to talk about the *how*.
Today we will be taking a look at the top 3 elements found in all good trading plans!
1️⃣ Element 1: Every good trading plan knows why it wins.
In trading, there are two variables that matter: Bat Rate, and Win / Loss.
► Bat Rate describes what percentage of the time a trade ends up as a win. A trader with a 90% bat rate wins 9 out of every 10 trades.
► Win / Loss describes how big the average win is, relative to the average loss. A trader with a 0.5 Win / Loss takes losses twice the size of his wins.
If you multiply these numbers together, you will get an “Expected Value”.
For example, a trader with a Bat Rate of 50% (wins half of the time) and a Win / Loss of 1 (Losses the same size as wins) is a perfectly “Breakeven” trader.
In order to make money in the long term, all you need to do is make the multiplication of these values be a positive value. The breakeven trader above only needs to win 51% of trades to begin making money, if his W/L remains constant.
☝🏽To get these numbers into positive “expected value” territory, every good trading plan needs to devise a way to systematically find trading opportunities that it thinks have an edge. The inputs of this system are completely up to the trader, but they are typically rooted in repeating price patterns, fundamental observations, macro trends, or other patterns and cycles. Backtesting can be useful here for getting a general idea of whether or not an idea for a trading strategy has borne out to be true over time.
In short, no matter what it looks like, good trading plans identify their edge before risking capital. Why start a business without a business plan?
2️⃣ Element 2: Every good trading plan takes into account the emotional character of the trader.
This is the hardest element to quantify, but also arguably one of the most important pieces of a good written trading plan - the ability to work around a trader’s individual strengths and weaknesses. This is less important for banks and hedge funds, as decisions are typically made with oversight, but for retail traders, there is no-one around to temper your personal flaws.
You can do whatever you want! - but it’s a double edged sword of responsibility that your trading plan needs to prepare you for.
In short, you can best get an idea of where you are emotionally weakest by looking at your trading history. Nobody can do this for you, so it requires quite a bit of self-awareness. However, the rewards of removing emotional risk from a trading plan make it worth the effort.
😱 All trading is based on fear. You need to understand which fear is stronger - the fear of missing out, or the fear of losing capital. Figure out which is stronger, and plan accordingly.
Just because you understand a certain strategy and other people make money trading it, doesn’t mean that you will be able to. Executing with 100% consistency at 30% efficiency is more important than finding a strategy with 100% efficiency that you can only trade with 10% consistency. Make life easy on yourself!
3️⃣ Element 3: Every good trading plan outlines risk.
Whether you have one thousand dollars or one billion dollars, ignoring risk is a sure way to experience massively increased monetary and emotional volatility, which can have a huge negative impact on long term profitability. Here are a few simple-to-implement mechanisms that Banks, Hedge Funds, and Prop Firms use to reduce risk significantly - good trading plans don’t skip these.
💵 Total Account Stop
Exactly what it sounds like: once you lose a certain percentage of your capital, you stop trading, liquidate your positions, and assess what went wrong. Only once you’re satisfied that you have fixed the issue are you allowed to re-enter the market. In the industry, this number is commonly 10%.
💵 Per Theme Risk
This ensures that you aren’t too concentrated on a single “bet”, even if the bet is spread across multiple instruments. For example, if you own multiple companies in the same sector, their performance will likely be correlated to some degree even if they have different products or services. Adding a hard cap to this type of risk can massively reduce risky or over concentrated allocations.
💵 Per Position Risk
Many successful Professional Traders and Hedge Funds use the concept of “Free Capital” in order to manage risk. “Free Capital” is the amount of money in hard dollars that makes up the buffer between an account’s current equity, and the total account stop number.
For example, If a currency trader at a bank has a 10% total account stop out, and runs a $10,000,000 currency book, then he can really only “lose” $1,000,000 before his bosses pull him aside to have a talk. His “Free Capital” is $1,000,000. He will then size his positions to where he only risks 1-5% of his Free Capital per trade. This way, he has room to be wrong a minimum of 20 times in a row before any negative consequences come his way. Implementing a “free capital” risk limit per position ensures that you have a TON of room for error.
Yes, this typically prevents you from doubling your account overnight, but again, that isn’t the goal. Long term profitability is.
Some people call this per position risk “one R” (one risk unit).
☝🏽Whatever it looks like, including a plan for managing your risk is essential for *actually* managing your risk. If these plans aren’t written out and acted upon, they’re also a lot easier to ignore.
🙏🏽 Thanks for reading; we are looking forward to making 2022 a record setting year with you. 📈
If you got something out of this, make sure to share it with a friend, so they can also go into 2022 a better trader! 🍀
- The TradingView Team ❤️❤️

a few outcomes, both are bullish!🚀docn bottom is near! but theres still a few outcomes here. If it respects its history, We will see a bounce here and continue higher.
but a possible outcome is a dip into previous trend channel, then breakout once it bounces off that. Like the title says, both are good setups for longs, we just have to play it right. Thats the hard part of course ! 🤑
like and follow for more 💘

